
https://matplotlib.org/api/pyplot_summary.html
在交互环境中查看帮助文档:
- import matplotlib.pyplot as plt
- help(plt.plot)
以下是对帮助文档重要部分的翻译:
plot函数的一般的调用形式:
- #单条线:
- plot([x], y, [fmt], data=None, **kwargs)
- #多条线一起画
- plot([x], y, [fmt], [x2], y2, [fmt2], ..., **kwargs)
可选参数[fmt] 是一个字符串来定义图的基本属性如:颜色(color),点型(marker),线型(linestyle),
具体形式 fmt = '[color][marker][line]'
fmt接收的是每个属性的单个字母缩写,例如:
plot(x, y, 'bo-') # 蓝色圆点实线若属性用的是全名则不能用*fmt*参数来组合赋值,应该用关键字参数对单个属性赋值如:
plot(x,y2,color='green', marker='o', linestyle='dashed', linewidth=1, markersize=6)
plot(x,y3,color='#900302',marker='+',linestyle='-')
常见的颜色参数:**Colors**
也可以对关键字参数color赋十六进制的RGB字符串如 color='#900302'
- ============= ===============================
- character color
- ============= ===============================
- ``'b'`` blue 蓝
- ``'g'`` green 绿
- ``'r'`` red 红
- ``'c'`` cyan 蓝绿
- ``'m'`` magenta 洋红
- ``'y'`` yellow 黄
- ``'k'`` black 黑
- ``'w'`` white 白
- ============= ===============================
点型参数**Markers**,如:marker='+' 这个只有简写,英文描述不被识别- ============= ===============================
- character description
- ============= ===============================
- ``'.'`` point marker
- ``','`` pixel marker
- ``'o'`` circle marker
- ``'v'`` triangle_down marker
- ``'^'`` triangle_up marker
- ``'<'`` triangle_left marker
- ``'>'`` triangle_right marker
- ``'1'`` tri_down marker
- ``'2'`` tri_up marker
- ``'3'`` tri_left marker
- ``'4'`` tri_right marker
- ``'s'`` square marker
- ``'p'`` pentagon marker
- ``'*'`` star marker
- ``'h'`` hexagon1 marker
- ``'H'`` hexagon2 marker
- ``'+'`` plus marker
- ``'x'`` x marker
- ``'D'`` diamond marker
- ``'d'`` thin_diamond marker
- ``'|'`` vline marker
- ``'_'`` hline marker
- ============= ===============================

线型参数**Line Styles**,linestyle='-'
- ============= ===============================
- character description
- ============= ===============================
- ``'-'`` solid line style 实线
- ``'--'`` dashed line style 虚线
- ``'-.'`` dash-dot line style 点画线
- ``':'`` dotted line style 点线
- ============= ===============================
样例1
- 函数原型:matplotlib.pyplot.plot(*args, scalex=True, scaley=True, data=None, **kwargs)
- >>> plot('xlabel', 'ylabel', data=obj)
- 解释:All indexable objects are supported. This could e.g. be a dict, a pandas.DataFame or a structured numpy array.
- data 参数接受一个对象数据类型,所有可被索引的对象都支持,如 dict 等
- import matplotlib.pyplot as plt
- import numpy as np
- '''read file
- fin=open("para.txt")
- a=[]
- for i in fin:
- a.append(float(i.strip()))
- a=np.array(a)
- a=a.reshape(9,3)
- '''
- a=np.random.random((9,3))*2 #随机生成y
-
- y1=a[0:,0]
- y2=a[0:,1]
- y3=a[0:,2]
-
- x=np.arange(1,10)
-
- ax = plt.subplot(111)
- width=10
- hight=3
- ax.arrow(0,0,0,hight,width=0.01,head_width=0.1, head_length=0.3,length_includes_head=True,fc='k',ec='k')
- ax.arrow(0,0,width,0,width=0.01,head_width=0.1, head_length=0.3,length_includes_head=True,fc='k',ec='k')
-
- ax.axes.set_xlim(-0.5,width+0.2)
- ax.axes.set_ylim(-0.5,hight+0.2)
-
- plotdict = { 'dx': x, 'dy': y1 }
- ax.plot('dx','dy','bD-',data=plotdict)
-
- ax.plot(x,y2,'r^-')
- ax.plot(x,y3,color='#900302',marker='*',linestyle='-')
-
- plt.show()

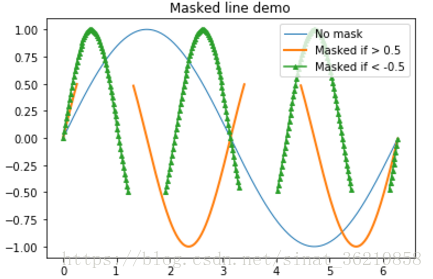
样例2,
- import matplotlib.pyplot as plt
- import numpy as np
-
- x = np.arange(0, 2*np.pi, 0.02)
- y = np.sin(x)
- y1 = np.sin(2*x)
- y2 = np.sin(3*x)
- ym1 = np.ma.masked_where(y1 > 0.5, y1)
- ym2 = np.ma.masked_where(y2 < -0.5, y2)
-
- lines = plt.plot(x, y, x, ym1, x, ym2, 'o')
- #设置线的属性
- plt.setp(lines[0], linewidth=1)
- plt.setp(lines[1], linewidth=2)
- plt.setp(lines[2], linestyle='-',marker='^',markersize=4)
- #线的标签
- plt.legend(('No mask', 'Masked if > 0.5', 'Masked if < -0.5'), loc='upper right')
- plt.title('Masked line demo')
- plt.show()
例3 :圆
- import numpy as np
- import matplotlib.pyplot as plt
-
- theta = np.arange(0, 2*np.pi, 0.01)
- xx = [1,2,3,10,15,8]
- yy = [1,-1,0,0,7,0]
- rr = [7,7,3,6,9,9]
-
- fig = plt.figure()
- axes = flg.add_subplot(111)
-
- i = 0
- while i < len(xx):
- x = xx[i] + rr[i] *np.cos(theta)
- x = xx[i] + rr[i] *np.cos(theta)
- axes.plot(x,y)
- axes.plot(xx[i], yy[i], color='#900302', marker='*')
- i = i+1
- width = 20
- hight = 20
- axes.arrow(0,0,0,hight,width=0.01,head_width=0.1,head_length=0.3,fc='k',ec='k')
- axes.arrow(0,0,width,0,width=0.01,head_width=0.1,head_length=0.3,fc='k',ec='k')
- plt.show()
文章知识点与官方知识档案匹配,可进一步学习相关知识
Python入门技能树绘图库MatplotlibMatplotlib快速入门336432 人正在系统学习中
评论记录:
回复评论: