Matplotlib炫酷饼图绘制指南:参数详解与实战技巧
引言
Matplotlib是一个强大的Python绘图库,可以用于创建各种类型的图表,包括饼图。在本文中,我们将深入探讨Matplotlib中绘制不同种类炫酷饼图的参数说明和代码实战。我们将介绍自定义饼图、百分比显示、多个子图、圆环饼图以及嵌套饼图的绘制方法。
1. 自定义饼图
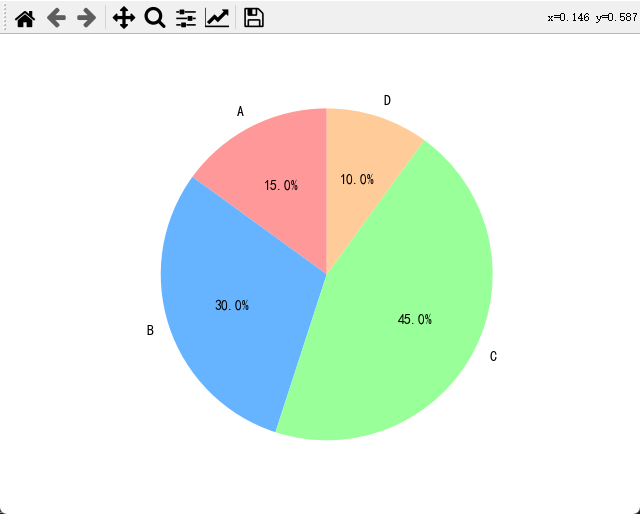
Matplotlib允许用户自定义饼图的外观,包括颜色、标签、阴影等。以下是一个简单的例子:
import matplotlib.pyplot as plt

# 数据
labels = ['A', 'B', 'C', 'D']
sizes = [15, 30, 45, 10]

# 自定义颜色
colors = ['#ff9999','#66b3ff','#99ff99','#ffcc99']

# 绘制饼图
plt.pie(sizes, labels=labels, colors=colors, autopct='%1.1f%%', startangle=90)

# 设置圆形
plt.axis('equal')

# 显示图形
plt.show()
- 1
- 2
- 3
- 4
- 5
- 6
- 7
- 8
- 9
- 10
- 11
- 12
- 13
- 14
- 15
- 16
- 17
在这个例子中,我们使用autopct参数显示百分比,并使用startangle参数设置起始角度。
2. 百分比显示
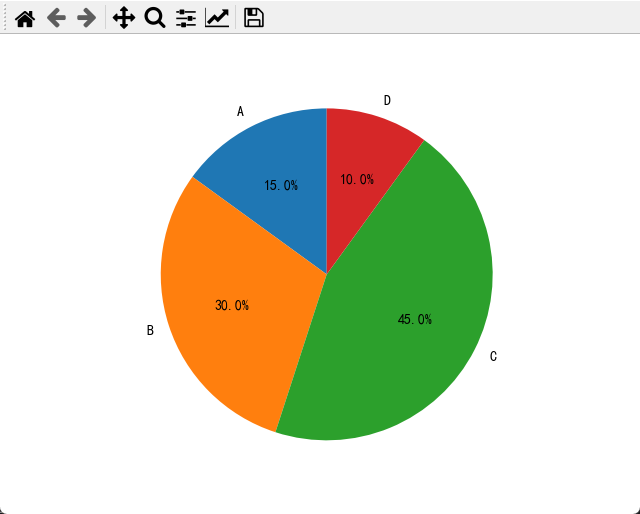
通过设置autopct参数,我们可以在饼图中显示每个部分的百分比:
import matplotlib.pyplot as plt

# 数据
labels = ['A', 'B', 'C', 'D']
sizes = [15, 30, 45, 10]

# 绘制饼图并显示百分比
plt.pie(sizes, labels=labels, autopct='%1.1f%%', startangle=90)

# 设置圆形
plt.axis('equal')

# 显示图形
plt.show()
- 1
- 2
- 3
- 4
- 5
- 6
- 7
- 8
- 9
- 10
- 11
- 12
- 13
- 14
3. 多个子图
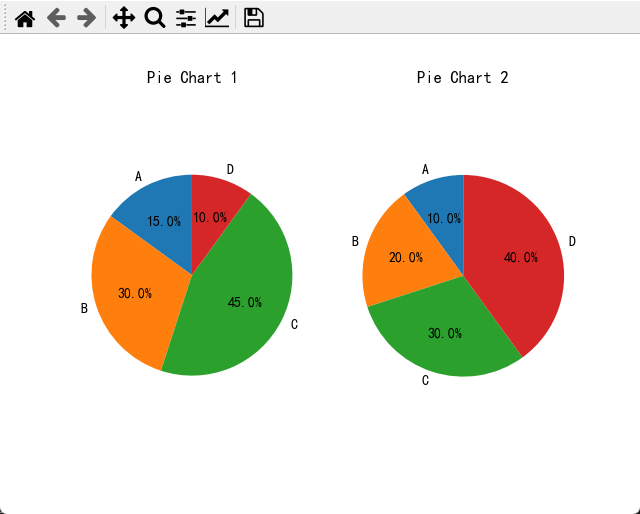
Matplotlib允许在同一图中创建多个子图。下面的例子展示了如何在一个图中放置两个饼图:
import matplotlib.pyplot as plt

# 数据
labels = ['A', 'B', 'C', 'D']
sizes1 = [15, 30, 45, 10]
sizes2 = [10, 20, 30, 40]

# 创建子图
fig, axs = plt.subplots(1, 2)

# 绘制第一个饼图
axs[0].pie(sizes1, labels=labels, autopct='%1.1f%%', startangle=90)
axs[0].set_title('Pie Chart 1')

# 绘制第二个饼图
axs[1].pie(sizes2, labels=labels, autopct='%1.1f%%', startangle=90)
axs[1].set_title('Pie Chart 2')

# 设置圆形
for ax in axs:
    ax.axis('equal')

# 显示图形
plt.show()
- 1
- 2
- 3
- 4
- 5
- 6
- 7
- 8
- 9
- 10
- 11
- 12
- 13
- 14
- 15
- 16
- 17
- 18
- 19
- 20
- 21
- 22
- 23
- 24
4. 圆环饼图
要绘制圆环饼图,可以使用wedgeprops参数设置饼图的属性,例如边界颜色和宽度:
import matplotlib.pyplot as plt

# 数据
labels = ['A', 'B', 'C', 'D']
sizes = [15, 30, 45, 10]

# 绘制圆环饼图
plt.pie(sizes, labels=labels, autopct='%1.1f%%', startangle=90, wedgeprops=dict(width=0.3))

# 设置圆形
plt.axis('equal')

# 显示图形
plt.show()
- 1
- 2
- 3
- 4
- 5
- 6
- 7
- 8
- 9
- 10
- 11
- 12
- 13
- 14
5. 嵌套饼图
通过在饼图中嵌套另一个饼图,可以创建嵌套的效果:
import matplotlib.pyplot as plt

# 数据
labels_outer = ['A', 'B']
sizes_outer = [70, 30]

labels_inner = ['C', 'D']
sizes_inner = [40, 60]

# 绘制外层饼图
plt.pie(sizes_outer, labels=labels_outer, autopct='%1.1f%%', startangle=90)

# 绘制内层饼图
plt.pie(sizes_inner, labels=labels_inner, autopct='%1.1f%%', startangle=90, radius=0.7)

# 设置圆形
plt.axis('equal')

# 显示图形
plt.show()
- 1
- 2
- 3
- 4
- 5
- 6
- 7
- 8
- 9
- 10
- 11
- 12
- 13
- 14
- 15
- 16
- 17
- 18
- 19
- 20
6. 饼图的其他参数说明
在Matplotlib中,饼图还有一些其他重要的参数,可以用来调整图形的样式和布局。以下是一些常用的参数:
-
explode: 通过设置此参数,可以将某一块饼图分离出来,突出显示。例如:explode = (0, 0.1, 0, 0) # 分别对应各块饼图,0.1表示分离程度 plt.pie(sizes, labels=labels, autopct='%1.1f%%', startangle=90, explode=explode)- 1
- 2
-
shadow: 添加阴影效果,通过设置shadow=True启用阴影:plt.pie(sizes, labels=labels, autopct='%1.1f%%', startangle=90, shadow=True)- 1
-
colors: 设置各部分的颜色,可以是一个颜色列表:colors = ['red', 'green', 'blue', 'orange'] plt.pie(sizes, labels=labels, autopct='%1.1f%%', startangle=90, colors=colors)- 1
- 2
代码实战:综合运用参数
下面是一个综合运用多个参数的例子,创建一个炫酷的饼图:
import matplotlib.pyplot as plt

# 数据
labels = ['A', 'B', 'C', 'D']
sizes = [15, 30, 45, 10]
explode = (0, 0.1, 0, 0)
colors = ['#ff9999','#66b3ff','#99ff99','#ffcc99']

# 绘制饼图
plt.pie(sizes, labels=labels, autopct='%1.1f%%', startangle=90, explode=explode, shadow=True, colors=colors)

# 设置圆形
plt.axis('equal')

# 添加标题
plt.title('Cool Pie Chart')

# 显示图形
plt.show()
- 1
- 2
- 3
- 4
- 5
- 6
- 7
- 8
- 9
- 10
- 11
- 12
- 13
- 14
- 15
- 16
- 17
- 18
- 19
通过结合不同参数,我们可以创建出吸引人的、炫酷的饼图效果。
7. 导出图形
在创建炫酷饼图之后,您可能希望将图形保存为图像文件,以便在演示文稿、报告或网站中使用。Matplotlib提供了保存图形的功能,您可以使用savefig方法将图形保存为文件。例如,将上述代码修改为保存为PNG图像:
import matplotlib.pyplot as plt

# 数据
labels = ['A', 'B', 'C', 'D']
sizes = [15, 30, 45, 10]
explode = (0, 0.1, 0, 0)
colors = ['#ff9999', '#66b3ff', '#99ff99', '#ffcc99']

# 绘制饼图
plt.pie(sizes, labels=labels, autopct='%1.1f%%', startangle=90, explode=explode, shadow=True, colors=colors)

# 设置圆形
plt.axis('equal')

# 添加标题
plt.title('Cool Pie Chart')

# 保存为PNG图像
plt.savefig('cool_pie_chart.png')

# 显示图形
plt.show()
- 1
- 2
- 3
- 4
- 5
- 6
- 7
- 8
- 9
- 10
- 11
- 12
- 13
- 14
- 15
- 16
- 17
- 18
- 19
- 20
- 21
- 22
执行上述代码后,会生成一个名为cool_pie_chart.png的PNG图像文件,包含了绘制的炫酷饼图。
8. 交互式显示
在Jupyter Notebook等交互式环境中,Matplotlib的魔法命令 %matplotlib inline 可以让图形直接嵌入到Notebook中,实时显示图形。在Notebook中使用Matplotlib时,通常需要使用以下命令:
%matplotlib inline
import matplotlib.pyplot as plt
- 1
- 2
9. 高级定制化
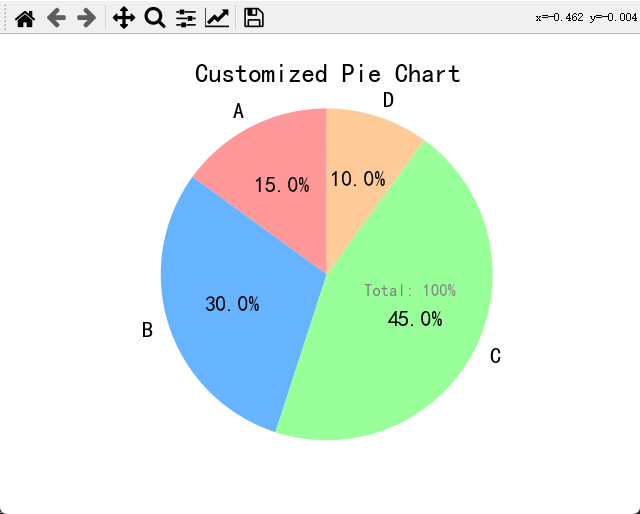
Matplotlib提供了许多高级定制化的选项,以满足用户对图形外观的更细致要求。例如,可以使用plt.rcParams设置全局的默认参数,或者使用plt.text在图形中添加文本标签。
import matplotlib.pyplot as plt

# 数据
labels = ['A', 'B', 'C', 'D']
sizes = [15, 30, 45, 10]
colors = ['#ff9999', '#66b3ff', '#99ff99', '#ffcc99']

# 自定义参数
plt.rcParams['font.size'] = 16
plt.rcParams['lines.linewidth'] = 2

# 绘制饼图
plt.pie(sizes, labels=labels, autopct='%1.1f%%', startangle=90, colors=colors)

# 设置圆形
plt.axis('equal')

# 添加标题
plt.title('Customized Pie Chart')

# 在图形中添加文本标签
plt.text(0.5, -0.1, 'Total: 100%', ha='center', va='center', fontsize=12, color='gray')

# 显示图形
plt.show()
- 1
- 2
- 3
- 4
- 5
- 6
- 7
- 8
- 9
- 10
- 11
- 12
- 13
- 14
- 15
- 16
- 17
- 18
- 19
- 20
- 21
- 22
- 23
- 24
- 25
通过设置font.size、lines.linewidth等参数,您可以更改图形的默认字体大小和线条宽度。此外,使用plt.text可以在图形中的指定位置添加文本标签,使图形更富有信息。
10. 三维饼图
Matplotlib不仅支持二维饼图,还可以绘制三维饼图。要绘制三维饼图,可以使用mplot3d模块。
import matplotlib.pyplot as plt
from mpl_toolkits.mplot3d import Axes3D

# 数据
labels = ['A', 'B', 'C', 'D']
sizes = [15, 30, 45, 10]

# 创建3D图形对象
fig = plt.figure()
ax = fig.add_subplot(111, projection='3d')

# 绘制3D饼图
ax.pie(sizes, labels=labels, autopct='%1.1f%%', startangle=90)

# 设置图形属性
ax.set_aspect('auto')

# 添加标题
ax.set_title('3D Pie Chart')

# 显示图形
plt.show()
- 1
- 2
- 3
- 4
- 5
- 6
- 7
- 8
- 9
- 10
- 11
- 12
- 13
- 14
- 15
- 16
- 17
- 18
- 19
- 20
- 21
- 22
通过导入Axes3D,可以在Matplotlib中创建一个3D图形对象,进而绘制出引人注目的三维饼图。
总结
在本文中,我们深入探讨了Matplotlib库中绘制不同种类炫酷饼图的参数说明和代码实战。通过学习自定义饼图、百分比显示、多个子图、圆环饼图、嵌套饼图等技术,我们能够更灵活地呈现数据信息,提高数据可视化的效果。
通过代码实例,我们学习了如何使用Matplotlib库创建具有吸引力的饼图,并探讨了各种参数的应用,包括颜色设置、百分比显示、阴影效果、圆环饼图、嵌套饼图等。了解这些参数的用法,可以根据实际需求创建出丰富多样、令人印象深刻的数据可视化图形。
此外,我们还介绍了其他高级定制化选项,例如全局参数设置、文本标签的添加,以及如何保存图形为图像文件。通过这些技巧,用户可以更加灵活地调整图形的样式和布局,满足不同场景下的需求。
Matplotlib作为Python中最受欢迎的绘图库之一,为数据科学家和工程师提供了强大的工具。通过深入理解和熟练运用Matplotlib,我们能够创造出美观、富有信息的数据可视化作品,有效地传达数据背后的故事。
在学习和使用Matplotlib的过程中,不断实践和尝试是提高技能的关键。希望本文提供的知识和实例能够帮助读者更好地应用Matplotlib库,提升数据可视化的水平。

评论记录:
回复评论: