
前言
yolo算法作为one-stage领域的佼佼者,采用anchor-based的方法进行目标检测,使用不同尺度的anchor直接回归目标框并一次性输出目标框的位置和类别置信度。
为什么使用anchor进行检测?
最初的YOLOv1的初始训练过程很不稳定,在YOLOv2的设计过程中,作者观察了大量图片的ground truth,发现相同类别的目标实例具有相似的gt长宽比:比如车,gt都是矮胖的长方形;比如行人,gt都是瘦高的长方形。所以作者受此启发,从数据集中预先准备几个几率比较大的bounding box,再以它们为基准进行预测。
anchor的检测过程
首先,yolov5中使用的coco数据集输入图片的尺寸为640x640,但是训练过程的输入尺寸并不唯一,因为v5可以采用masaic增强技术把4张图片的部分组成了一张尺寸一定的输入图片。但是如果需要使用预训练权重,最好将输入图片尺寸调整到与作者相同的尺寸,而且输入图片尺寸必须是32的倍数,这与下面anchor检测的阶段有关。
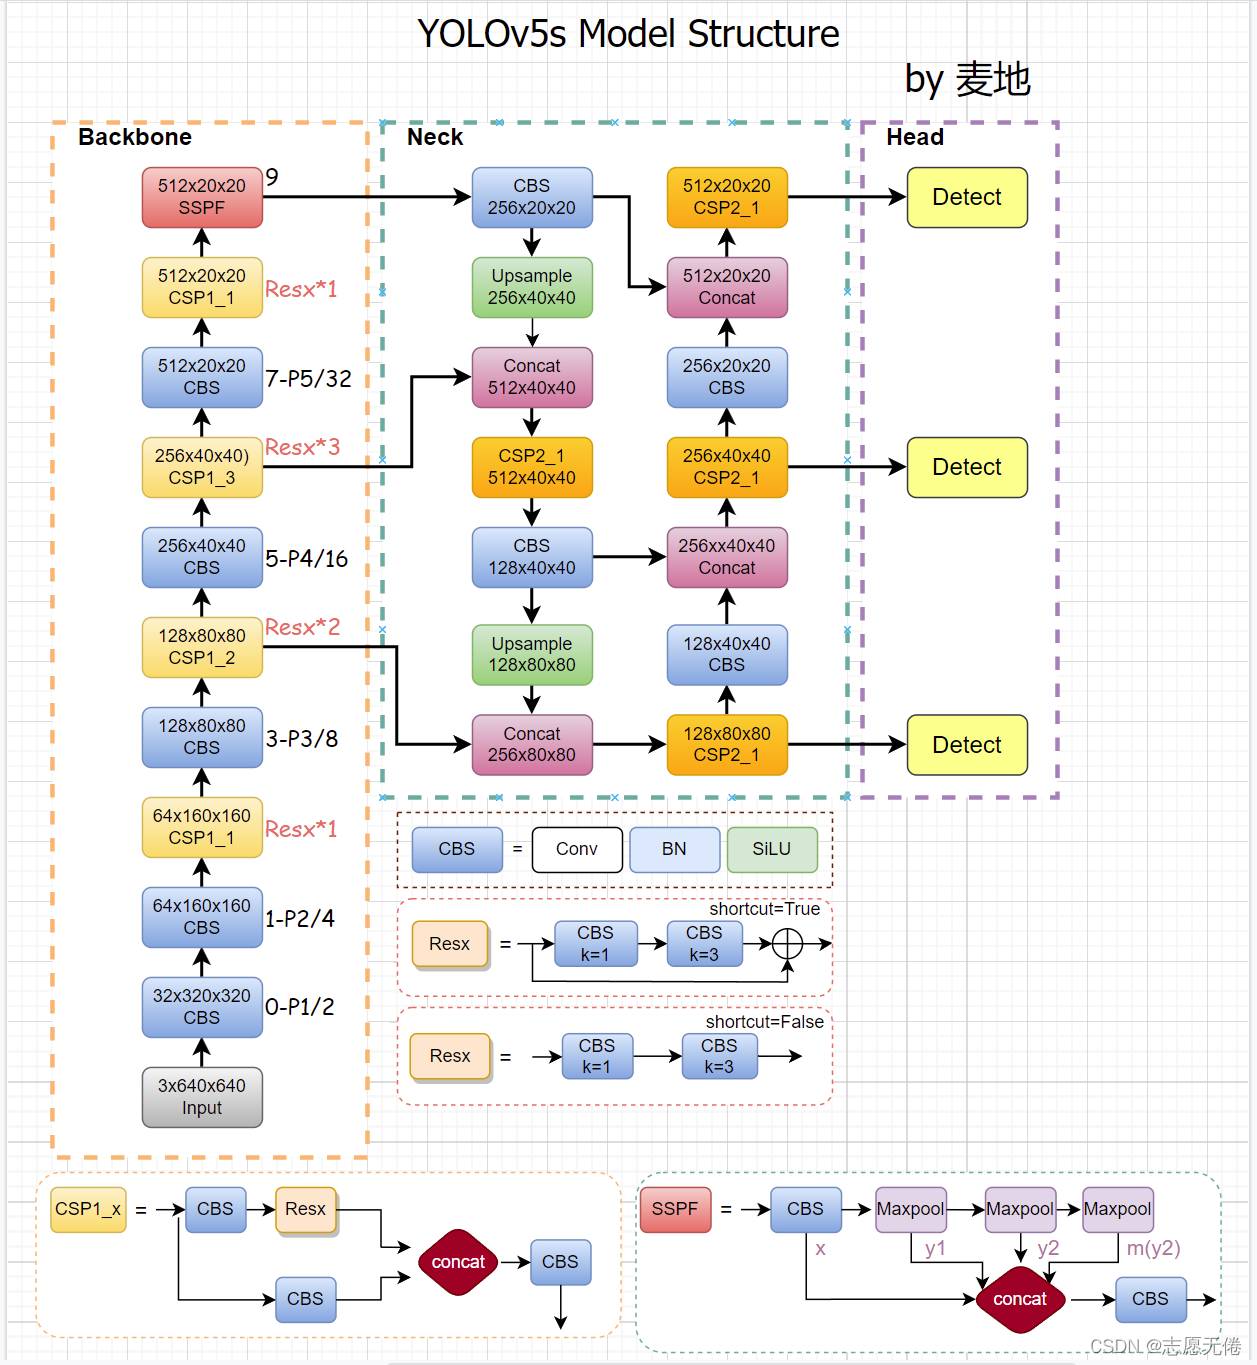
上图是我自己绘制的v5 v6.0的网络结构图。当我们的输入尺寸为640*640时,会得到3个不同尺度的输出:80x80(640/8)、40x40(640/16)、20x20(640/32),即上图中的CSP2_3模块的输出。
anchors:
  - [10,13, 16,30, 33,23]  # P3/8
  - [30,61, 62,45, 59,119]  # P4/16
  - [116,90, 156,198, 373,326]  # P5/32
- 1
- 2
- 3
- 4
其中,80x80代表浅层的特征图(P3),包含较多的低层级信息,适合用于检测小目标,所以这一特征图所用的anchor尺度较小;同理,20x20代表深层的特征图(P5),包含更多高层级的信息,如轮廓、结构等信息,适合用于大目标的检测,所以这一特征图所用的anchor尺度较大。另外的40x40特征图(P4)上就用介于这两个尺度之间的anchor用来检测中等大小的目标。yolov5之所以能高效快速地检测跨尺度目标,这种对不同特征图使用不同尺度的anchor的思想功不可没。
以上就是yolov5中的anchors的具体解释。
anchor产生过程
对于大部分图片而言,由于其尺寸与我们预设的输入尺寸不符,所以在输入阶段就做了resize,导致预先标注的bounding box大小也发生变化。而anchor是根据我们输入网络中的bounding box大小计算得到的,所以在这个resize过程中就存在anchor重新聚类的过程。在yolov5/utils/autoanchor.py文件下,有一个函数kmeans_anchor,通过kmeans的方法计算得到anchor。具体如下:
def kmean_anchors(dataset='./data/coco128.yaml', n=9, img_size=640, thr=4.0, gen=1000, verbose=True):
    """ Creates kmeans-evolved anchors from training dataset

        Arguments:
            dataset: path to data.yaml, or a loaded dataset
            n: number of anchors
            img_size: image size used for training
            thr: anchor-label wh ratio threshold hyperparameter hyp['anchor_t'] used for training, default=4.0
            gen: generations to evolve anchors using genetic algorithm
            verbose: print all results

        Return:
            k: kmeans evolved anchors

        Usage:
            from utils.autoanchor import *; _ = kmean_anchors()
    """
    from scipy.cluster.vq import kmeans

    thr = 1. / thr
    prefix = colorstr('autoanchor: ')

    def metric(k, wh):  # compute metrics
        r = wh[:, None] / k[None]
        x = torch.min(r, 1. / r).min(2)[0]  # ratio metric
        # x = wh_iou(wh, torch.tensor(k))  # iou metric
        return x, x.max(1)[0]  # x, best_x

    def anchor_fitness(k):  # mutation fitness
        _, best = metric(torch.tensor(k, dtype=torch.float32), wh)
        return (best * (best > thr).float()).mean()  # fitness

    def print_results(k):
        k = k[np.argsort(k.prod(1))]  # sort small to large
        x, best = metric(k, wh0)
        bpr, aat = (best > thr).float().mean(), (x > thr).float().mean() * n  # best possible recall, anch > thr
        print(f'{prefix}thr={thr:.2f}: {bpr:.4f} best possible recall, {aat:.2f} anchors past thr')
        print(f'{prefix}n={n}, img_size={img_size}, metric_all={x.mean():.3f}/{best.mean():.3f}-mean/best, '
              f'past_thr={x[x > thr].mean():.3f}-mean: ', end='')
        for i, x in enumerate(k):
            print('%i,%i' % (round(x[0]), round(x[1])), end=',  ' if i < len(k) - 1 else '
')  # use in *.cfg
        return k

    if isinstance(dataset, str):  # *.yaml file
        with open(dataset, errors='ignore') as f:
            data_dict = yaml.safe_load(f)  # model dict
        from datasets import LoadImagesAndLabels
        dataset = LoadImagesAndLabels(data_dict['train'], augment=True, rect=True)

    # Get label wh
    shapes = img_size * dataset.shapes / dataset.shapes.max(1, keepdims=True)
    wh0 = np.concatenate([l[:, 3:5] * s for s, l in zip(shapes, dataset.labels)])  # wh

    # Filter
    i = (wh0 < 3.0).any(1).sum()
    if i:
        print(f'{prefix}WARNING: Extremely small objects found. {i} of {len(wh0)} labels are < 3 pixels in size.')
    wh = wh0[(wh0 >= 2.0).any(1)]  # filter > 2 pixels
    # wh = wh * (np.random.rand(wh.shape[0], 1) * 0.9 + 0.1)  # multiply by random scale 0-1

    # Kmeans calculation
    print(f'{prefix}Running kmeans for {n} anchors on {len(wh)} points...')
    s = wh.std(0)  # sigmas for whitening
    k, dist = kmeans(wh / s, n, iter=30)  # points, mean distance
    assert len(k) == n, f'{prefix}ERROR: scipy.cluster.vq.kmeans requested {n} points but returned only {len(k)}'
    k *= s
    wh = torch.tensor(wh, dtype=torch.float32)  # filtered
    wh0 = torch.tensor(wh0, dtype=torch.float32)  # unfiltered
    k = print_results(k)

    # Plot
    # k, d = [None] * 20, [None] * 20
    # for i in tqdm(range(1, 21)):
    #     k[i-1], d[i-1] = kmeans(wh / s, i)  # points, mean distance
    # fig, ax = plt.subplots(1, 2, figsize=(14, 7), tight_layout=True)
    # ax = ax.ravel()
    # ax[0].plot(np.arange(1, 21), np.array(d) ** 2, marker='.')
    # fig, ax = plt.subplots(1, 2, figsize=(14, 7))  # plot wh
    # ax[0].hist(wh[wh[:, 0]<100, 0],400)
    # ax[1].hist(wh[wh[:, 1]<100, 1],400)
    # fig.savefig('wh.png', dpi=200)

    # Evolve
    npr = np.random
    f, sh, mp, s = anchor_fitness(k), k.shape, 0.9, 0.1  # fitness, generations, mutation prob, sigma
    pbar = tqdm(range(gen), desc=f'{prefix}Evolving anchors with Genetic Algorithm:')  # progress bar
    for _ in pbar:
        v = np.ones(sh)
        while (v == 1).all():  # mutate until a change occurs (prevent duplicates)
            v = ((npr.random(sh) < mp) * random.random() * npr.randn(*sh) * s + 1).clip(0.3, 3.0)
        kg = (k.copy() * v).clip(min=2.0)
        fg = anchor_fitness(kg)
        if fg > f:
            f, k = fg, kg.copy()
            pbar.desc = f'{prefix}Evolving anchors with Genetic Algorithm: fitness = {f:.4f}'
            if verbose:
                print_results(k)

    return print_results(k)
- 1
- 2
- 3
- 4
- 5
- 6
- 7
- 8
- 9
- 10
- 11
- 12
- 13
- 14
- 15
- 16
- 17
- 18
- 19
- 20
- 21
- 22
- 23
- 24
- 25
- 26
- 27
- 28
- 29
- 30
- 31
- 32
- 33
- 34
- 35
- 36
- 37
- 38
- 39
- 40
- 41
- 42
- 43
- 44
- 45
- 46
- 47
- 48
- 49
- 50
- 51
- 52
- 53
- 54
- 55
- 56
- 57
- 58
- 59
- 60
- 61
- 62
- 63
- 64
- 65
- 66
- 67
- 68
- 69
- 70
- 71
- 72
- 73
- 74
- 75
- 76
- 77
- 78
- 79
- 80
- 81
- 82
- 83
- 84
- 85
- 86
- 87
- 88
- 89
- 90
- 91
- 92
- 93
- 94
- 95
- 96
- 97
- 98
- 99
代码的注释部分其实已经对参数及调用方法解释的很清楚了,这里我只简单说一下:
Arguments:
          dataset: 数据的yaml路径
          n: 类簇的个数
          img_size: 训练过程中的图片尺寸(32的倍数)
          thr: anchor的长宽比阈值,将长宽比限制在此阈值之内
          gen: k-means算法最大迭代次数(不理解的可以去看k-means算法)
          verbose: 打印参数

Usage:
          from utils.autoanchor import *; _ = kmean_anchors()
- 1
- 2
- 3
- 4
- 5
- 6
- 7
- 8
- 9
- 10
评论记录:
回复评论: