
基础版笔记目录:
python3+opencv学习笔记汇总目录(适合基础入门学习)
进阶版笔记目录链接:
python+opencv进阶版学习笔记目录(适合有一定基础)
轮廓发现
1轮廓发现介绍
基础版讲解:
opencv学习笔记20:图像轮廓

2轮廓发现API
cv2.findContours()
cv2.drawContours()
通过cv2.findContours() 查找轮廓在哪里,再通过 cv2.drawContours()将查找的轮廓绘制出来。
contours,hierarchy=cv2.findContours(image,mode,method)
contours:轮廓
hierarchy:图像的拓扑信息(轮廓层次)(存储上一个轮廓,父轮廓…)
image:二值图像
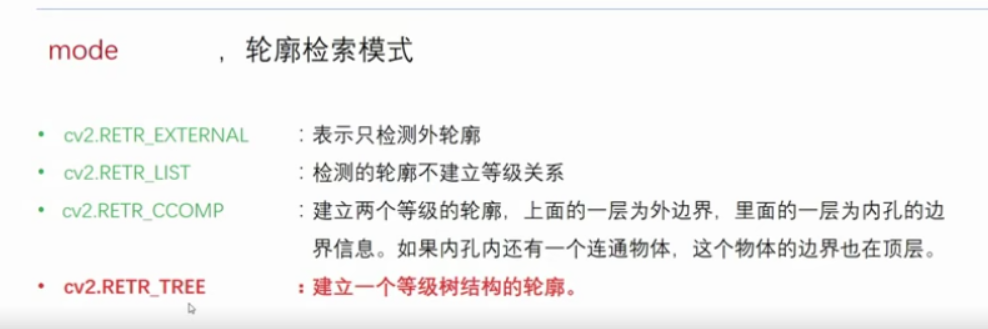
mode:轮廓检索方式
method:轮廓的近似方法

r=cv2.drawContours(image, contours, contourIdx, color[, thickness])
r:目标图像
image:原始图像
contours: 所有的输入轮廓边缘数组
contourIdx :需要绘制的边缘索引,如果全部绘制为-1。如果有多个目标,可以绘制第一个目标0,第二个目标1,第三个目标2.。。
color:绘制的颜色,为BGR格式的SCalar
thickness:可选,绘制的密度,即轮廓的画笔粗细
import cv2 as cv
import numpy as np


#边缘提取
def edge_demo(image):
    blurred = cv.GaussianBlur(image, (3, 3), 0)#去噪
    gray = cv.cvtColor(blurred, cv.COLOR_BGR2GRAY)
    # X Gradient
    xgrad = cv.Sobel(gray, cv.CV_16SC1, 1, 0)
    # Y Gradient
    ygrad = cv.Sobel(gray, cv.CV_16SC1, 0, 1)
    #edge
    #edge_output = cv.Canny(xgrad, ygrad, 50, 150)
    edge_output = cv.Canny(gray, 30, 100)
    cv.imshow("Canny Edge", edge_output)
    return edge_output


def contours_demo(image):
    """dst = cv.GaussianBlur(image, (3, 3), 0)
    gray = cv.cvtColor(dst, cv.COLOR_BGR2GRAY)
    ret, binary = cv.threshold(gray, 0, 255, cv.THRESH_BINARY | cv.THRESH_OTSU)#cv.THRESH_OTSU自动寻找阈值
    cv.imshow("binary image", binary)"""
    binary = edge_demo(image)#边缘提取后的二值图像

    contours, heriachy = cv.findContours(binary, cv.RETR_EXTERNAL, cv.CHAIN_APPROX_SIMPLE)
    for i, contour in enumerate(contours):
        cv.drawContours(image, contours, i, (0, 0, 255), 2)
    cv.imshow("detect contours", image)
print("--------- Python OpenCV Tutorial ---------")
src = cv.imread("daqiu.jpg")
cv.namedWindow("input image", cv.WINDOW_AUTOSIZE)
cv.imshow("input image", src)
contours_demo(src)
cv.waitKey(0)
cv.destroyAllWindows()
- 1
- 2
- 3
- 4
- 5
- 6
- 7
- 8
- 9
- 10
- 11
- 12
- 13
- 14
- 15
- 16
- 17
- 18
- 19
- 20
- 21
- 22
- 23
- 24
- 25
- 26
- 27
- 28
- 29
- 30
- 31
- 32
- 33
- 34
- 35
- 36
- 37

前面是通过边缘提取,然后再来寻找轮廓的。
改用
基于图像二值化方法 来提取
def contours_demo(image):
    dst = cv.GaussianBlur(image, (3, 3), 0)
    gray = cv.cvtColor(dst, cv.COLOR_BGR2GRAY)
    ret, binary = cv.threshold(gray, 0, 255, cv.THRESH_BINARY | cv.THRESH_OTSU)#cv.THRESH_OTSU自动寻找阈值
    cv.imshow("binary image", binary)
    #binary = edge_demo(image)#边缘提取后的二值图像

    contours, heriachy = cv.findContours(binary, cv.RETR_EXTERNAL, cv.CHAIN_APPROX_SIMPLE)
    for i, contour in enumerate(contours):
        cv.drawContours(image, contours, i, (0, 0, 255), 2)
    cv.imshow("detect contours", image)
- 1
- 2
- 3
- 4
- 5
- 6
- 7
- 8
- 9
- 10
- 11

差点意思,还是基于边缘提取更好。
对象测量
对象测量:对找到的图像轮廓,计算它弧长与面积,多边形拟合,几何矩计算
多边形拟合API
获取轮廓的多边形拟合结果
cv2.approxPolyDP(contour,epsilon,close)
参数:
contour 轮廓
epsilon越小越折线越逼近真实形状
close – 是否为闭合区域
输出的是多边形点集
import cv2 as cv
import numpy as np


def measure_object(image):
    gray = cv.cvtColor(image, cv.COLOR_BGR2GRAY)
    ret, binary = cv.threshold(gray, 0, 255, cv.THRESH_BINARY_INV | cv.THRESH_OTSU)
    print("threshold value : %s"%ret)#打印阈值
    cv.imshow("binary image", binary)#显示二值图像
    dst = cv.cvtColor(binary, cv.COLOR_GRAY2BGR)
    contours, hireachy = cv.findContours(binary, cv.RETR_EXTERNAL, cv.CHAIN_APPROX_SIMPLE)
    for i, contour in enumerate(contours):
        area = cv.contourArea(contour)# 求轮廓面积
        x, y, w, h = cv.boundingRect(contour)# 求轮廓外接矩形
        rate = min(w, h)/max(w, h)
        print("rectangle rate : %s"%rate)#宽高比
        mm = cv.moments(contour)# 求几何矩,返回字典类型
        print(type(mm))
        # 求得图形的重心坐标
        cx = mm['m10']/mm['m00']
        cy = mm['m01']/mm['m00']
        cv.circle(dst, (np.int(cx), np.int(cy)), 3, (0, 255, 255), -1)#绘制轮廓中心

        cv.rectangle(dst, (x, y), (x+w, y+h), (0, 0, 255), 2)#在原图上,给轮廓绘制矩形
        print("contour area %s"%area)
    cv.imshow("measure-contours", dst)


print("--------- Python OpenCV Tutorial ---------")
src = cv.imread("shuzi.jpg")
src=cv.resize(src,None,fx=0.5,fy=0.5)
cv.namedWindow("input image", cv.WINDOW_AUTOSIZE)
cv.imshow("input image", src)
measure_object(src)
cv.waitKey(0)
cv.destroyAllWindows()
- 1
- 2
- 3
- 4
- 5
- 6
- 7
- 8
- 9
- 10
- 11
- 12
- 13
- 14
- 15
- 16
- 17
- 18
- 19
- 20
- 21
- 22
- 23
- 24
- 25
- 26
- 27
- 28
- 29
- 30
- 31
- 32
- 33
- 34
- 35
- 36
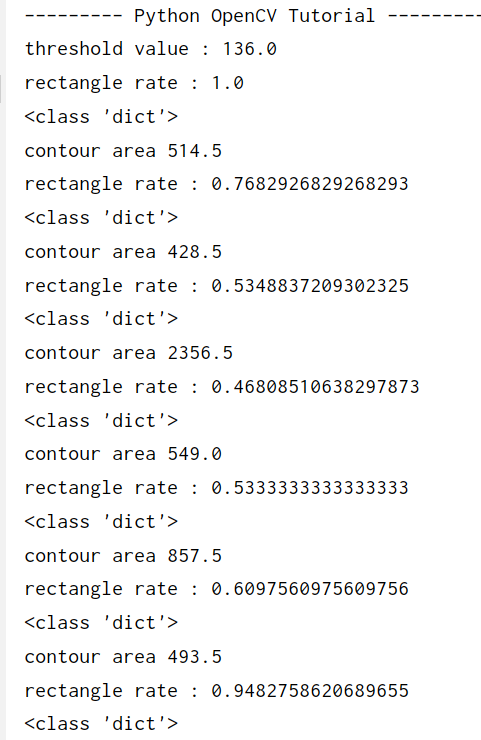
计算出啦每个数字的面积,宽高比,可以用于简单数字识别
注意 原图中数字为黑色, 需要反二值化 ,使数字为轮廓,因为轮廓为白色
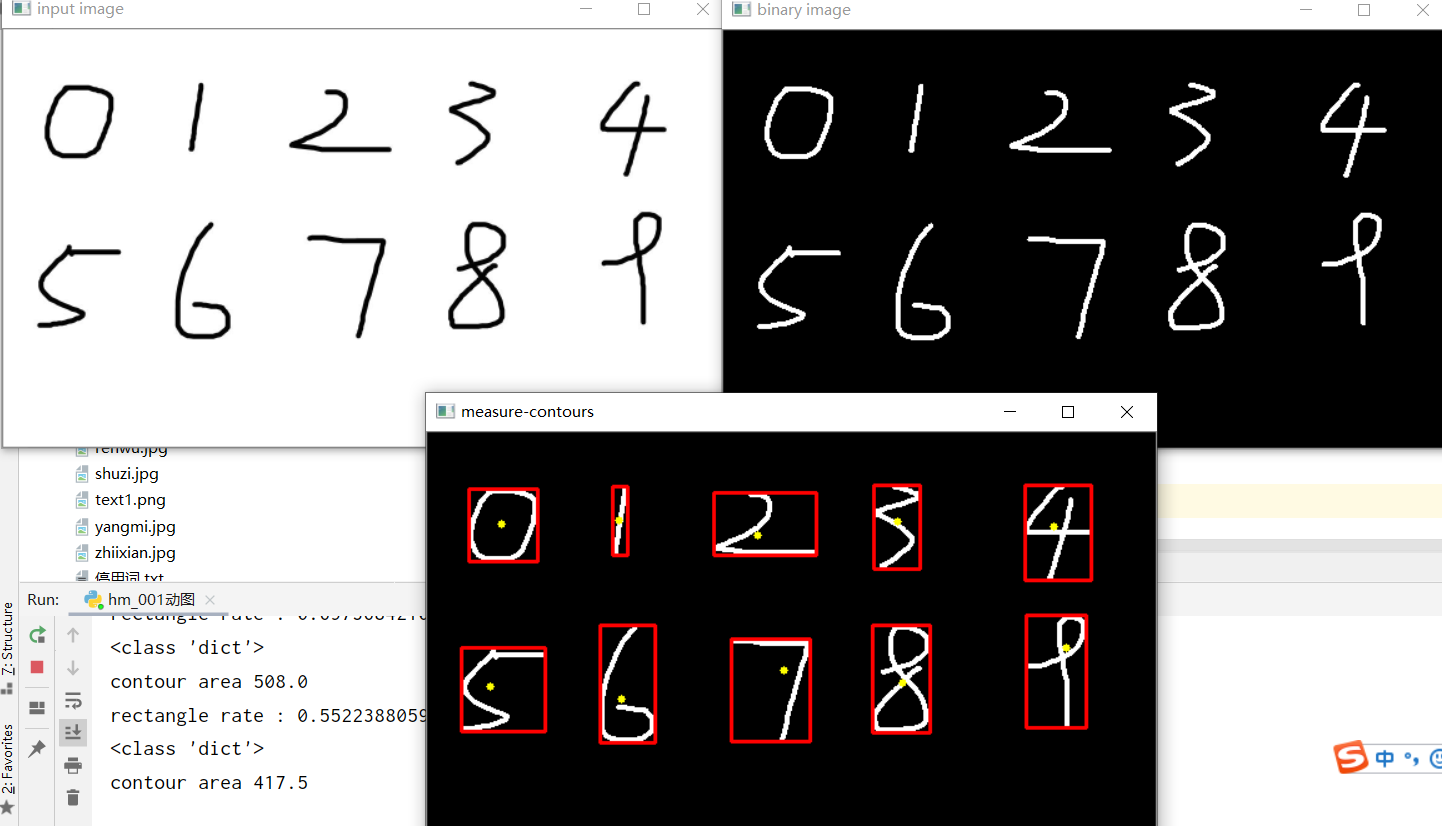
注意事项:有些图太小时,cx = mm['m10']/mm['m00'] cy = mm['m01']/mm['m00'] 出现分母为0,报错。所以得首先把图放大
如src=cv.resize(src,None,fx=1.5,fy=1.5)
算例2
import cv2 as cv
import numpy as np


def measure_object(image):
    gray = cv.cvtColor(image, cv.COLOR_BGR2GRAY)
    ret, binary = cv.threshold(gray, 0, 255, cv.THRESH_BINARY | cv.THRESH_OTSU)
    print("threshold value : %s"%ret)#打印阈值
    cv.imshow("binary image", binary)#显示二值图像
    dst = cv.cvtColor(binary, cv.COLOR_GRAY2BGR)
    contours, hireachy = cv.findContours(binary, cv.RETR_EXTERNAL, cv.CHAIN_APPROX_SIMPLE)
    for i, contour in enumerate(contours):
        area = cv.contourArea(contour)# 求轮廓面积
        x, y, w, h = cv.boundingRect(contour)# 求轮廓外接矩形
        rate = min(w, h)/max(w, h)
        #print("rectangle rate : %s"%rate)
        mm = cv.moments(contour)# 求几何矩,返回字典类型
        print(type(mm))
        # 求得图形的重心坐标
        cx = mm['m10']/mm['m00']
        cy = mm['m01']/mm['m00']
        cv.circle(dst, (np.int(cx), np.int(cy)), 3, (0, 255, 255), -1)#绘制轮廓中心

        #cv.rectangle(dst, (x, y), (x+w, y+h), (0, 0, 255), 2)
        #print("contour area %s"%area)
        #轮廓多边形拟合
        approxCurve = cv.approxPolyDP(contour,2, True)
        #print(approxCurve.shape)
        print(approxCurve.shape)

        #轮廓拟合
        if approxCurve.shape[0] > 6:
            cv.drawContours(dst, contours, i, (0, 255, 0), 2)#i表示第几个轮廓
        if approxCurve.shape[0] == 4:
            cv.drawContours(dst, contours, i, (0, 0, 255), 2)
        if approxCurve.shape[0] == 3:
            cv.drawContours(dst, contours, i, (255, 0, 0), 2)

    cv.imshow("measure-contours", dst)
print("--------- Python OpenCV Tutorial ---------")
src = cv.imread("duobianxin.jpg")
src=cv.resize(src,None,fx=1.5,fy=1.5)
cv.namedWindow("input image", cv.WINDOW_AUTOSIZE)
cv.imshow("input image", src)
measure_object(src)
cv.waitKey(0)

cv.destroyAllWindows()
- 1
- 2
- 3
- 4
- 5
- 6
- 7
- 8
- 9
- 10
- 11
- 12
- 13
- 14
- 15
- 16
- 17
- 18
- 19
- 20
- 21
- 22
- 23
- 24
- 25
- 26
- 27
- 28
- 29
- 30
- 31
- 32
- 33
- 34
- 35
- 36
- 37
- 38
- 39
- 40
- 41
- 42
- 43
- 44
- 45
- 46
- 47
- 48
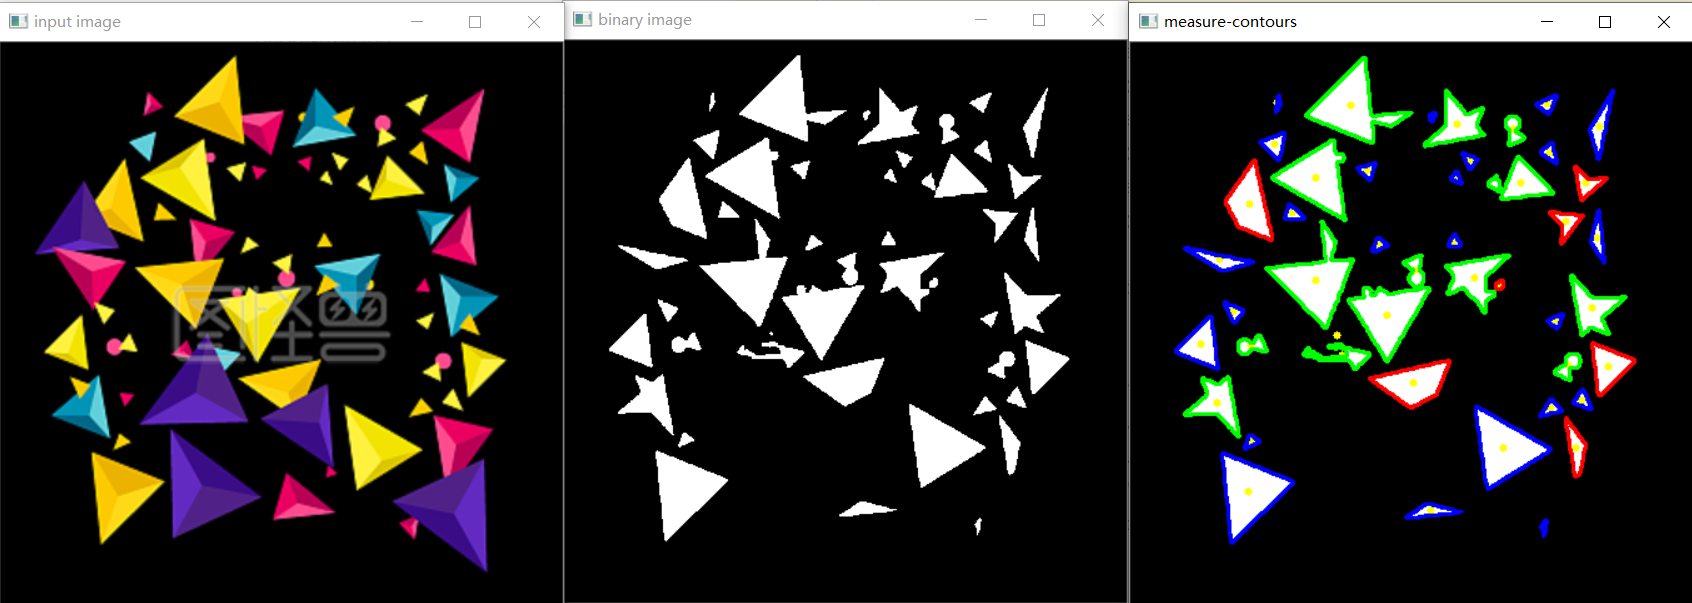
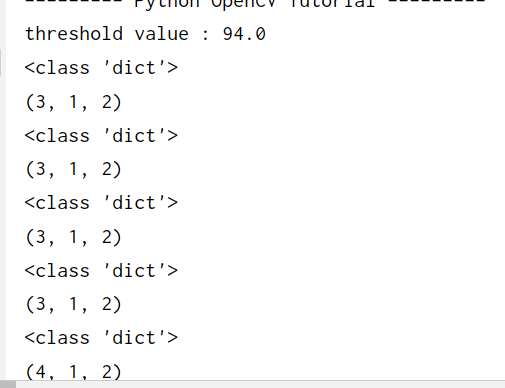
部分print(approxCurve.shape)数据如下
approxCurve.shape 有三维数据,第一维表示轮廓可以由几条线绘制出来,如三角形由三条直线就可绘制。如if approxCurve.shape[0] == 3: cv.drawContours(dst, contours, i, (255, 0, 0), 2)
图中蓝色均有3条绘制
同样要注意图的大小
电气专业的计算机萌新,写博文不容易。如果你觉得本文对你有用,请点个赞支持下,谢谢。
评论记录:
回复评论: