NetCDF(network Common Data Form)网络通用数据格式是一种面向数组型并适于网络共享的数据的描述和编码标准。目前,NetCDF广泛应用于大气科学、水文、海洋学、环境模拟、地球物理等诸多领域。用户可以借助多种方式方便地管理和操作 NetCDF 数据集。
文件的后缀是.nc
这里采用python的一个专门用来处理.nc文件的库–netCDF4
该库的安装直接:
pip install netCDF4
这个库玩起来稍微比Pandas复杂一些。
下面以全球降水量数据为例进行举例:
首先导入相关库:
import numpy as np
import pandas as pd
import netCDF4 as nc
import matplotlib.pyplot as plt
from mpl_toolkits.basemap import Basemap
plt.rcParams['font.sans-serif']=['SimHei'] #显示中文标签
plt.rcParams['axes.unicode_minus']=False   #这两行需要手动设置
- 1
- 2
- 3
- 4
- 5
- 6
- 7
导入(.nc文件)数据集:
nf = nc.Dataset(r'precip.mon.total.1x1.v2018.nc','r')
- 1
直接输出查看nf会比较杂,先直接看下有什么变量:
nf.variables.keys()
- 1
输出:
dict_keys([‘lat’, ‘lon’, ‘time’, ‘precip’])
可见这个数据集无非4项数据:纬度,经度,时间,降水量
我们先来查看下这些数据项长啥样:
#查看一下time的属性
nf.variables['time']
- 1
- 2
输出:
float64 time(time)
long_name: Time
units: days since 1800-1-1 00:00:00
delta_t: 0000-01-00 00:00:00
avg_period: 0000-01-00 00:00:00
standard_name: time
axis: T
coordinate_defines: start
actual_range: [33237. 79227.]
unlimited dimensions: time
current shape = (1512,)
filling on, default _FillValue of 9.969209968386869e+36 used
。。。看的一脸懵,莫慌。这其实是这些数据项的属性值
从units可以看出:是以从1800-1-1 00:00:00的天数累记储存的。
输出看看:
#查看一下time的数据
nf.variables['time'][:]
- 1
- 2
输出:
masked_array(data=[33237., 33268., 33296., …, 79166., 79197., 79227.],
mask=False,
fill_value=1e+20)
所以我们要想得到日期,那就得xxxx/365+1800为年份,太麻烦了。。莫慌
有个简便方法:
#将time转换成时间格式,因为看上面time的属性可以知道:units: days since 1800-1-1 00:00:00
#是以从1800-1-1 00:00:00的天数累记储存的。
#用.data直接把masked_array中的data数据读出。
time = nc.num2date(nf.variables['time'][:],'days since 1800-1-1 00:00:00').data
- 1
- 2
- 3
- 4
输出:
array([cftime.DatetimeGregorian(1891, 1, 1, 0, 0, 0, 0),
cftime.DatetimeGregorian(1891, 2, 1, 0, 0, 0, 0),
cftime.DatetimeGregorian(1891, 3, 1, 0, 0, 0, 0), …,
cftime.DatetimeGregorian(2016, 10, 1, 0, 0, 0, 0),
cftime.DatetimeGregorian(2016, 11, 1, 0, 0, 0, 0),
cftime.DatetimeGregorian(2016, 12, 1, 0, 0, 0, 0)], dtype=object)
真舒服变好看了,通过time[0].year我们是可以读取出第一个元素的年份信息。
把剩下的数据读出:
lats = nf.variables['lat'][:].data
lons = nf.variables['lon'][:].data
- 1
- 2
那么这里我们假设要取出2016年的降水量数据:如何操作??
先来看看降水量数据的属性信息:
nf.variables['precip']
- 1
float32 precip(time, lat, lon)
long_name: GPCC Monthly total of precipitation
missing_value: -9.96921e+36
statistic: Total
valid_range: [ 0. 8000.]
parent_stat: Observations
var_desc: Precipitation
units: mm
level: Surface
actual_range: [ 0. 3349.61]
dataset: GPCC Precipitation 1.0degree V2018 Full Reanalysis
unlimited dimensions: time
current shape = (1512, 180, 360)
filling on, default _FillValue of 9.969209968386869e+36 used
从中看到:
float32 precip(time, lat, lon):
可知:这个降水量数据是有3个维度的,分别是:时间,纬度,经度
所以可知纬度上的维度大小肯定是180,经度上的维度大小肯定是360嘿嘿。。
missing_value:-9.96921e+36:
说明元素值为:-9.96921e+36的为缺失值,预处理的时候要注意了。
units: mm:
说明降水量单位为mm
筛选数据:
没有pandas那么舒服,他是将2016年数据的索引找出来,然后再根据索引获取2016年的数据的。
#筛选2016年的全球降水量数据,一共12个月的
import dateutil.parser  #引入这个库来将日期字符串转成统一的datatime时间格式
all_times = nf.variables['time']
sdt = dateutil.parser.parse("2016-1-1T00:00:00")
edt = dateutil.parser.parse("2016-12-1T00:00:00")
st_idx = nc.date2index(sdt, all_times)
et_idx = nc.date2index(edt, all_times)
precip = nf.variables['precip'][st_idx:et_idx+1,:].data
- 1
- 2
- 3
- 4
- 5
- 6
- 7
- 8
再来简单处理一下缺失值吧,o(︶︿︶)o让缺失值为0 :
#缺失值处理:-9.96921e+36为缺失值
precip[precip==-9.96921e+36]=0
- 1
- 2
看看维度信息:
确实纬度180,经度360,没错。学过地理的都知道咯。(^U^) ,然后12指2016年的12个月的数据
precip.shape #(12, 180, 360)
- 1
下面就是用matplotlib的basemap的地图库可视化咯:
懂得都懂,这里就不介绍这个画图库了,网上很多参考资料。
这里将2016年的12个月的数据可视化并保存:
# 经纬度平均值
lon_0 = lons.mean()
lat_0 = lats.mean()
m = Basemap(lat_0=lat_0, lon_0=lon_0)
lon, lat = np.meshgrid(lons, lats)
xi, yi = m(lon, lat)
# 绘制经纬线
m.drawparallels(np.arange(-90., 91., 20.), labels=[1,0,0,0], fontsize=10)
m.drawmeridians(np.arange(-180., 181., 40.), labels=[0,0,0,1], fontsize=10)
# Add Coastlines, States, and Country Boundaries
m.drawcoastlines()
m.drawstates()
m.drawcountries()

for i in range(12):
    # Plot Data
    # 这里我的precip数据是24小时的,我这里只绘制第1小时的(precip_0)
    precip_0 = precip[i:i+1:, ::, ::]
    cs = m.pcolor(xi, yi, np.squeeze(precip_0))
    if i==0:

        # Add Colorbar
        cbar = m.colorbar(cs, location='right', pad="10%")
        cbar.set_label(nf.variables['precip'].units)
        # Add Title
    plt.title('2016年'+str(i+1)+'月'+'全球降水量分布')
    plt.savefig(str(i)+'.jpg',dpi=400)
- 1
- 2
- 3
- 4
- 5
- 6
- 7
- 8
- 9
- 10
- 11
- 12
- 13
- 14
- 15
- 16
- 17
- 18
- 19
- 20
- 21
- 22
- 23
- 24
- 25
- 26
- 27
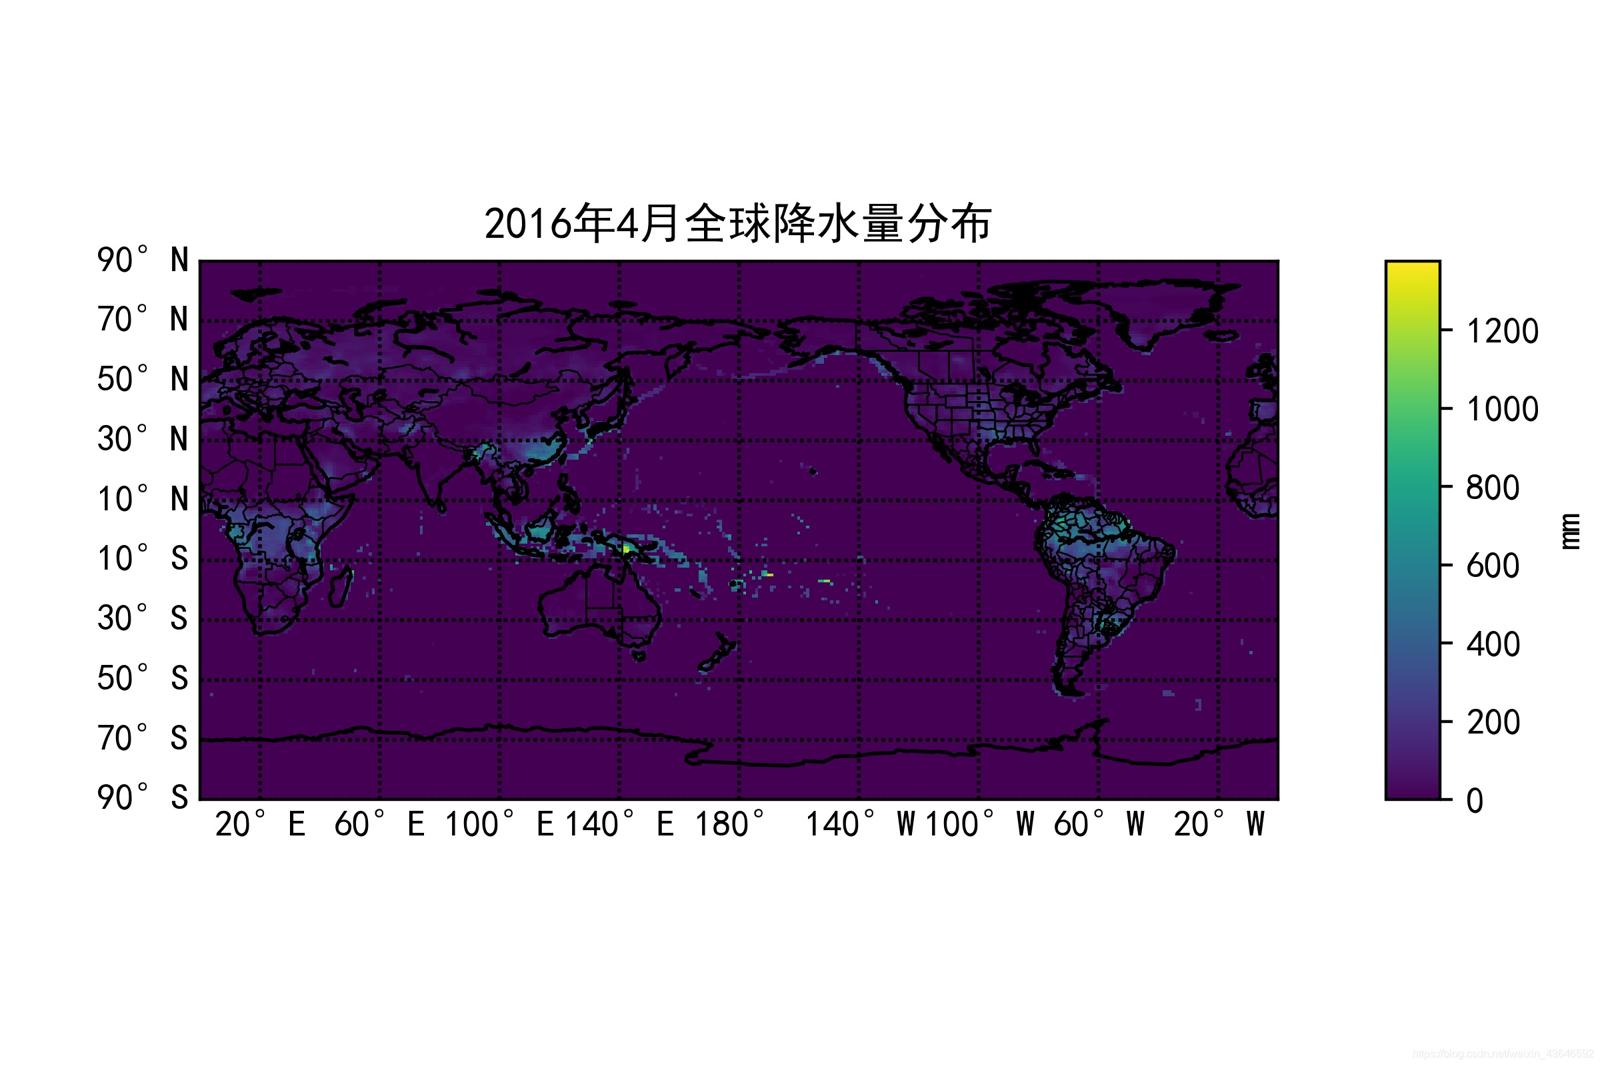
随便来一张效果(大家可以自己调调颜色还有刻度那些,调的好看一点,我这个有点丑,而且这份数据集缺失值较多好像,所以整体效果不漂亮):

如果你还想来点骚操作,让12个月的图呈现动态变化,那就用imageio库将其转成GIF图即可:
import imageio
frames = []
for i in range(12):
    frames.append(imageio.imread(str(i)+'.jpg'))
# Save them as frames into a gif
imageio.mimsave('动图.gif', frames, 'GIF', duration = 0.8)
- 1
- 2
- 3
- 4
- 5
- 6
数据:
- GPCC数据集下载网址(下载可能需要科学上网),该网站里有很多别的数据可下载:
https://psl.noaa.gov/data/gridded/data.gpcc.html
本文所用数据集(以上传到百度网盘):
链接:https://pan.baidu.com/s/1kNrNTtI9jqTHlOhGukShYA
提取码:zz5c
复制这段内容后打开百度网盘手机App,操作更方便哦
接触这个库时参考过的链接:
-
Python读取气象数据nc格式文件的入门级操作:
https://www.kesci.com/mw/project/5f1a407194d484002d2d9b2b/content -
气象数据处理——nc文件:
https://zhuanlan.zhihu.com/p/129351199?from_voters_page=true -
Python对气象数据的可视化
https://zhuanlan.zhihu.com/p/260514949 -
使用Python的netCDF4和matplotlib.basemap包进行气象数据的可视化
http://iyenn.com/rec/2146222.html -
python利用netCDF4处理气象数据(nc文件)
https://www.pianshen.com/article/42521104083/

评论记录:
回复评论: