
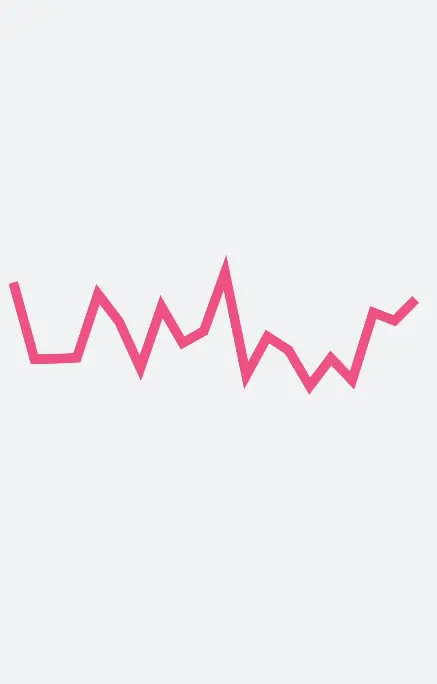
chart为图表组件,用于呈现线形图、柱状图和量规图界面。
创建chart组件
在pages/index目录下的hml文件中创建一个chart组件。
- 1
- 2
- 3
- 4
/* xxx.css */
.container {
  width: 100%;
  height: 100%;
  flex-direction: column;
  justify-content: center;
  align-items: center;
  background-color: #F1F3F5;
}
.chart-data {
  width: 700px;
  height: 600px;
}
- 1
- 2
- 3
- 4
- 5
- 6
- 7
- 8
- 9
- 10
- 11
- 12
- 13
// xxx.js
export default {
  data: {
    lineData: [
      {
        data: [763, 550, 551, 554, 731, 654, 525, 696, 595, 628, 791, 505, 613, 575, 475, 553, 491, 680, 657, 716]
      }
    ],
    lineOps: {
      xAxis: {
        min: 0,
        max: 20,
        display: false,
      },
      yAxis: {
        min: 0,
        max: 1000,
        display: false,
      },
      series: {
        lineStyle: {
          width: 15,
        },
      }
    },
  }
}

- 1
- 2
- 3
- 4
- 5
- 6
- 7
- 8
- 9
- 10
- 11
- 12
- 13
- 14
- 15
- 16
- 17
- 18
- 19
- 20
- 21
- 22
- 23
- 24
- 25
- 26
- 27
设置图表类型
chart组件通过设置type属性定义图表t类型,如将图表设置为柱状图。
        {{ title }}


            线形图
            柱状图
            量规图
- 1
- 2
- 3
- 4
- 5
- 6
- 7
- 8
- 9
- 10
- 11
- 12
- 13
- 14
- 15
- 16
- 17
- 18
- 19
- 20
- 21
- 22
- 23
- 24
- 25
- 26
- 27
- 28
- 29
- 30
- 31
- 32
- 33
- 34
/* xxx.css */
.container {
  width: 100%;
  height: 100%;
  flex-direction: column;
  justify-content: center;
  background-color: #F1F3F5;
}
.tab-bar{
  background-color: #F1F3F5;
}
.chart-data {
  width: 700px;
  height: 600px;
}
.title{
  margin-left: 50px;
  margin-top: 50px;
  font-size: 50px;
}
.line-block{
  align-items: center;
  justify-content: center;
}
.bar-block{
  align-items: center;
  justify-content: center;
}
.chart-block{
  width: 90%;
  margin-left: 30px;
}
- 1
- 2
- 3
- 4
- 5
- 6
- 7
- 8
- 9
- 10
- 11
- 12
- 13
- 14
- 15
- 16
- 17
- 18
- 19
- 20
- 21
- 22
- 23
- 24
- 25
- 26
- 27
- 28
- 29
- 30
- 31
- 32
// xxx.js
export default {
  data: {
    title: "类型展示",
    barData: [
      {
        fillColor: '#3848e8',
        data: [763, 550, 551, 554, 731, 654, 525, 696, 595],
      }
    ],
    lineData: [
      {
        strokeColor: '#0081ff',
        fillColor: '#cce5ff',
        data: [763, 550, 551, 554, 731, 654, 525, 696, 595, 628, 791, 505, 613, 575, 475, 553, 491, 680, 657, 716],
        gradient: true,
      }
    ],
    lineOps: {
      xAxis: {
        min: 0,
        max: 20,
        display: false,
      },
      yAxis: {
        min: 0,
        max: 1000,
        display: false,
      },
      series:{
        lineStyle: {
          width: "5px",
          smooth: true,
        },
        headPoint: {
          shape:"circle",
          size: 20,
          strokeWidth: 5,
          fillColor: '#ffffff',
          strokeColor: '#007aff',
          display: true,
        },
        loop:{
          margin: 2,
          gradient: true
        }
      },
    },
    barOps: {
      xAxis: {
        min: 0,
        max: 20,
        display: false,
        axisTick: 10,
      },
      yAxis: {
        min: 0,
        max: 1000,
      },
    },
  },
}
- 1
- 2
- 3
- 4
- 5
- 6
- 7
- 8
- 9
- 10
- 11
- 12
- 13
- 14
- 15
- 16
- 17
- 18
- 19
- 20
- 21
- 22
- 23
- 24
- 25
- 26
- 27
- 28
- 29
- 30
- 31
- 32
- 33
- 34
- 35
- 36
- 37
- 38
- 39
- 40
- 41
- 42
- 43
- 44
- 45
- 46
- 47
- 48
- 49
- 50
- 51
- 52
- 53
- 54
- 55
- 56
- 57
- 58
- 59
- 60
- 61
- 62

说明
chart不支持显示每个点的值。
设置图表属性
chart组件在options属性中设置对x轴、y轴和数据序列参数的设置,在datasets属性里添加对线条颜色、填充颜色、填充渐变颜色和绘制点集的设置。
- 1
- 2
- 3
- 4
/* xxx.css */
.container {
  width: 100%;
  height: 100%;
  flex-direction: column;
  justify-content: center;
  align-items: center;
  background-color: #F1F3F5;
}
.chart-data {
  width: 700px;
  height: 600px;
}
- 1
- 2
- 3
- 4
- 5
- 6
- 7
- 8
- 9
- 10
- 11
- 12
- 13
// xxx.js
export default {
  data: {
    //线形图数据
    lineData: [
      {
        strokeColor: '#0081ff',
        fillColor: '#cce5ff',  //填充色
        data: [463, 250, 251, 254, 431, 354, 225, 396, 295, 328, 491, 205, 313, 275, 475, 553, 491, 380, 357, 416],
        gradient: true,
      }
    ],
    lineOps: {
     //x轴参数设置
      xAxis: {
        min: 0,
        max: 20,
        display: false,
      },
     //y轴参数设置
      yAxis: {
        min: 0,
        max: 1000,
        display: false,
      },
     //数据序列参数设置
      series: {
        //线样式设置
        lineStyle: {
          width: "5px",
          smooth: true,
        },
        //线最前端位置白点的样式和大小
        headPoint: {
          shape: "circle",
          size: 20,
          strokeWidth: 5,
          fillColor: '#ffffff',
          strokeColor: '#007aff',
          display: true,
        },
        //设置屏幕显示满时,是否需要重头开始绘制
        loop: {
          margin: 2,
          gradient: true
        }
      }
    },
  },
}
- 1
- 2
- 3
- 4
- 5
- 6
- 7
- 8
- 9
- 10
- 11
- 12
- 13
- 14
- 15
- 16
- 17
- 18
- 19
- 20
- 21
- 22
- 23
- 24
- 25
- 26
- 27
- 28
- 29
- 30
- 31
- 32
- 33
- 34
- 35
- 36
- 37
- 38
- 39
- 40
- 41
- 42
- 43
- 44
- 45
- 46
- 47
- 48
- 49
- 50
说明
- options只支持柱状图和线形图设置参数,量规图不生效。
- datasets只支持柱状图和线形图设置数据集合,量规图不生效。
- series只有线形图支持。
添加数据
通过chart组件的append方法,实现动态添加数据。
- 1
- 2
- 3
- 4
- 5
- 6
- 7
/* xxx.css */
.container {
  flex-direction: column;
  justify-content: center;
  align-items: center;
  background-color: #F1F3F5;
}
.chart-region {
  height: 400px;
  width: 700px;
}
.chart-data {
  width: 700px;
  height: 600px;
}
button {
  width: 100%;
  height: 50px;
  background-color: #F4F2F1;
  text-color: #0C81F3;
  margin-top: 30px;
}
- 1
- 2
- 3
- 4
- 5
- 6
- 7
- 8
- 9
- 10
- 11
- 12
- 13
- 14
- 15
- 16
- 17
- 18
- 19
- 20
- 21
- 22
// xxx.js
export default {
  data: {
    lineData: [
      {
        strokeColor: '#de0b6e',
        fillColor: '#bb09a3',
        data: [763, 550, 551, 554, 731, 654, 525, 696, 595, 628, 791, 505, 613, 575, 475, 553, 491, 680, 657, 716],
        gradient: true,
      }
    ],
    lineOps: {
      xAxis: {
      min: 0,
      max: 20,
      display: false,
      },
      yAxis: {
        min: 0,
        max: 1000,
        display: false,
      },
      series: {
        lineStyle: {
          width: "5px",
          smooth: true,
        },
        headPoint: {
          shape: "circle",
          size: 20,
          strokeWidth: 5,
          fillColor: '#ffffff',
          strokeColor: '#f8145c',
          display: true,
        },
        loop: {
          margin: 2,
          gradient: true,
        }
      }
    },
  },
  addData() {
    this.$refs.linechart.append({
    serial: 0,
      data: [Math.floor(Math.random() * 400) + 200]
    })
  }
}
- 1
- 2
- 3
- 4
- 5
- 6
- 7
- 8
- 9
- 10
- 11
- 12
- 13
- 14
- 15
- 16
- 17
- 18
- 19
- 20
- 21
- 22
- 23
- 24
- 25
- 26
- 27
- 28
- 29
- 30
- 31
- 32
- 33
- 34
- 35
- 36
- 37
- 38
- 39
- 40
- 41
- 42
- 43
- 44
- 45
- 46
- 47
- 48
- 49

场景示例
开发者可以根据开关Switch的状态来选择数据展示的状态,当Switch状态为true时,通过定时器来实现数据的动态展示。
      {{ title }}


               {{ $item.data }}


               {{ $item.value }}
- 1
- 2
- 3
- 4
- 5
- 6
- 7
- 8
- 9
- 10
- 11
- 12
- 13
- 14
- 15
- 16
- 17
- 18
- 19
- 20
- 21
- 22
- 23
- 24
- 25
- 26
- 27
- 28
- 29
- 30
- 31
- 32
- 33
- 34
- 35
- 36
- 37
- 38
- 39
- 40
- 41
- 42
- 43
- 44
- 45
/* xxx.css */
.container{
  display:flex;
  flex-direction:column;
  background-color: #F1F3F5;
}
.line-class{
  display: flex;
  flex-direction: column;
}
.title{
  font-size: 40px;
  margin-left: 40px;
}
.switch-block {
  margin-top: 30px;
  width: 98%;
  height: 80px;
  display: flex;
  justify-content: space-between;
}
.switch{
  font-size: 40px;
}
.bar-block {
  margin-top: 80px;
  margin-left: 40px;
  position: relative;
  width: 90%;
  border-radius: 10px;
  background-color: #25FAB27B;
  height: 40%;
  justify-content: center;
}
- 1
- 2
- 3
- 4
- 5
- 6
- 7
- 8
- 9
- 10
- 11
- 12
- 13
- 14
- 15
- 16
- 17
- 18
- 19
- 20
- 21
- 22
- 23
- 24
- 25
- 26
- 27
- 28
- 29
- 30
- 31
- 32
- 33
- 34
// xxx.js
export default {
  data: {
    interval: null,
    title: "数据展示",
    allowScale: true,
    dataLength: 30,
    barGroup: 3,
    lineData: null,
    lineOps: {
      xAxis: {
        min: 0,
        max: 5
      },
      yAxis: {
        min: 0,
        max: 100
      },
      series: {
        lineStyle: {
        width: '1px',
      },
        headPoint: {
          shape: 'circle',
          size: 10,
          strokeWidth: 2,
          fillColor: '#ffffff',
          strokeColor: '#8477DF'
        },
        loop: {
          margin: 2
        }
      }
    },
    barData: [
      {
        fillColor: '#97CF0A2C',
        data: [20, 20,40, 56]
      },
      {
        fillColor: '#6D0A7ACF',
        data: [52, 40, 2, 67]
      },
      {
        fillColor: '#6A0ACFA1',
        data: [56, 2, 77, 40]
      }
    ],
    barOps: {
      xAxis: {
        min: 0,
        max: 20,
        axisTick: 5
      },
      yAxis: {
        min: 0,
        max: 100
      }
    }
  },
  onInit() {
    this.changeLine();
  },
  change(e) {
    if (e.checked) {
      this.interval = setInterval(() => {
        this.changeLine();
        this.changeBar();
      }, 1000)
    } else {
      clearInterval(this.interval);
    }
  },
  changeLine() {
    var dataArray = [];
    for (var i = 0; i < this.dataLength; i++) {
      var nowValue = Math.floor(Math.random() * 99 + 1);
      var obj = {
        "value": nowValue,
        "description": nowValue + "",
        "textLocation": "top",
        "textColor": "#CDCACA",
        "pointStyle": {
          "shape": "circle",
          "size": 5,
          "fillColor": "#CF0A2C",
          "strokeColor": "#CF0A2C"
        }
      };
      dataArray.push(obj);
    }
    this.lineData = [
      {
        strokeColor: '#0081ff',
        fillColor: '#FF07CDC4',
        data: dataArray,
        gradient: true,
      }
    ]
  },
  changeBar() {
    for (var i = 0;i < this.barGroup; i++) {
      var dataArray = this.barData[i].data;
      for (var j = 0;j < 4; j++) {
        dataArray[j] = Math.floor(Math.random() * 99 + 1);
      }
    }
    this.barData = this.barData.splice(0, this.barGroup + 1);
  },
  changes(e) {
    console.log("Tab index: " + e.index);
  },
}
- 1
- 2
- 3
- 4
- 5
- 6
- 7
- 8
- 9
- 10
- 11
- 12
- 13
- 14
- 15
- 16
- 17
- 18
- 19
- 20
- 21
- 22
- 23
- 24
- 25
- 26
- 27
- 28
- 29
- 30
- 31
- 32
- 33
- 34
- 35
- 36
- 37
- 38
- 39
- 40
- 41
- 42
- 43
- 44
- 45
- 46
- 47
- 48
- 49
- 50
- 51
- 52
- 53
- 54
- 55
- 56
- 57
- 58
- 59
- 60
- 61
- 62
- 63
- 64
- 65
- 66
- 67
- 68
- 69
- 70
- 71
- 72
- 73
- 74
- 75
- 76
- 77
- 78
- 79
- 80
- 81
- 82
- 83
- 84
- 85
- 86
- 87
- 88
- 89
- 90
- 91
- 92
- 93
- 94
- 95
- 96
- 97
- 98
- 99
- 100
- 101
- 102
- 103
- 104
- 105
- 106
- 107
- 108
- 109
- 110
- 111
- 112
- 113

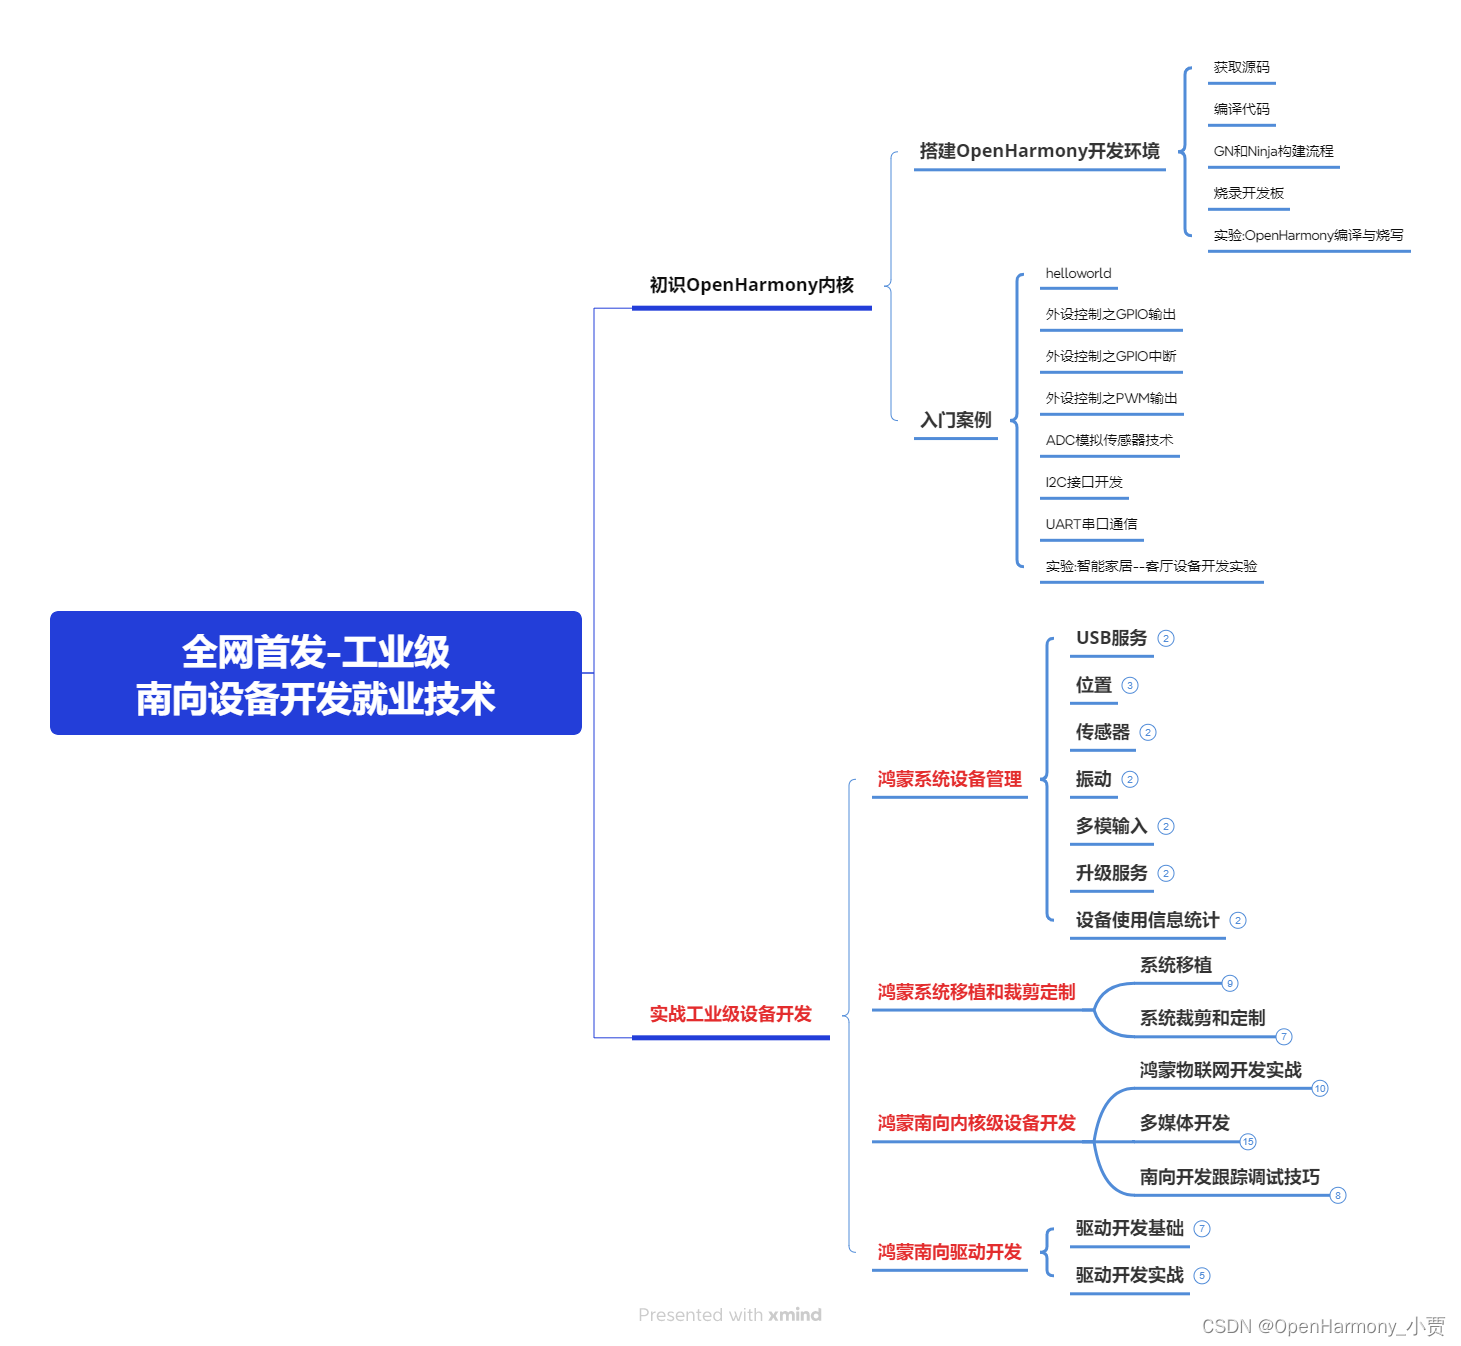
鸿蒙全栈开发全新学习指南
有很多小伙伴不知道学习哪些鸿蒙开发技术?不知道需要重点掌握哪些鸿蒙应用开发知识点?而且学习时频繁踩坑,最终浪费大量时间。所以要有一份实用的鸿蒙(HarmonyOS NEXT)学习路线与学习文档用来跟着学习是非常有必要的。
针对一些列因素,整理了一套纯血版鸿蒙(HarmonyOS Next)全栈开发技术的学习路线,包含了鸿蒙开发必掌握的核心知识要点,内容有(ArkTS、ArkUI开发组件、Stage模型、多端部署、分布式应用开发、WebGL、元服务、OpenHarmony多媒体技术、Napi组件、OpenHarmony内核、OpenHarmony驱动开发、系统定制移植等等)鸿蒙(HarmonyOS NEXT)技术知识点。
本路线共分为四个阶段:
第一阶段:鸿蒙初中级开发必备技能
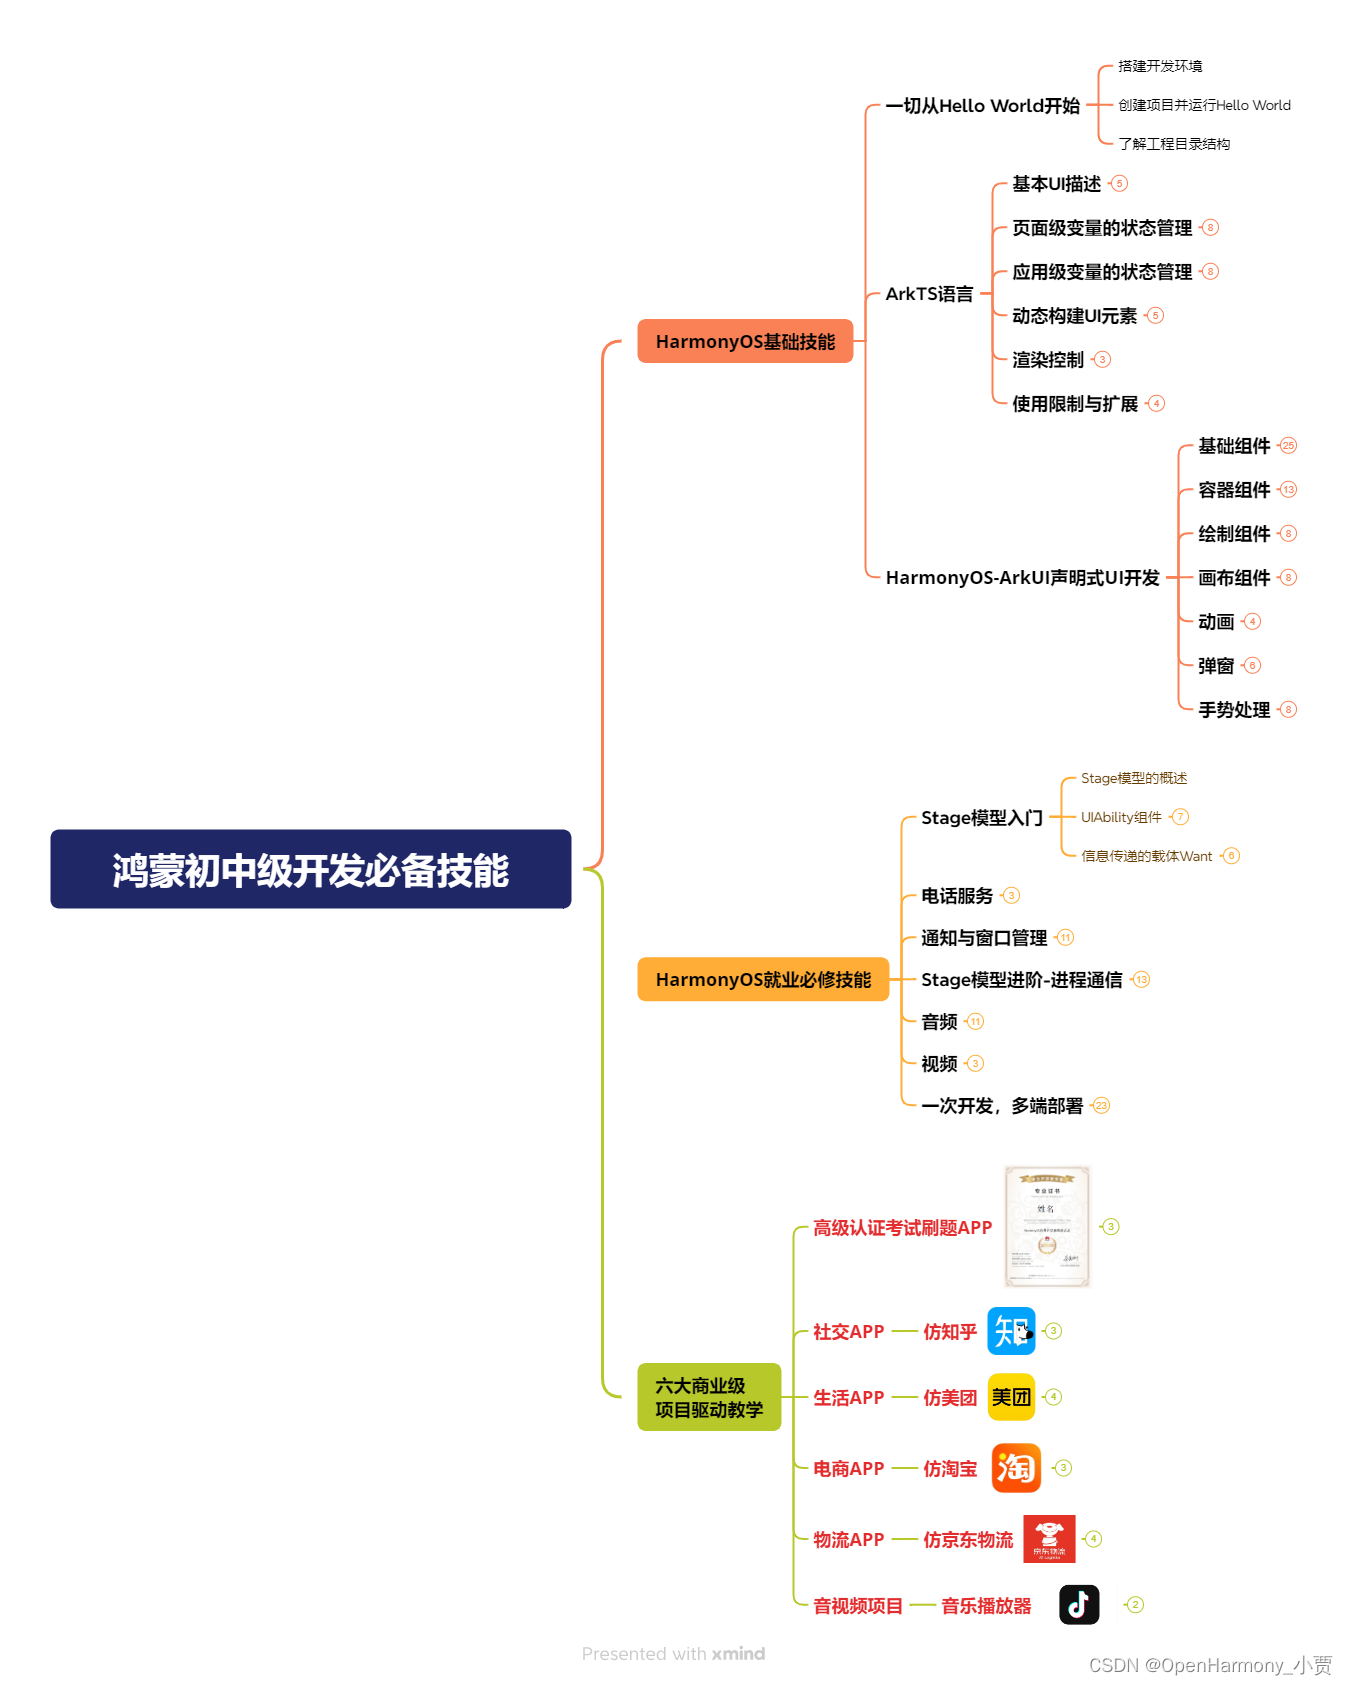
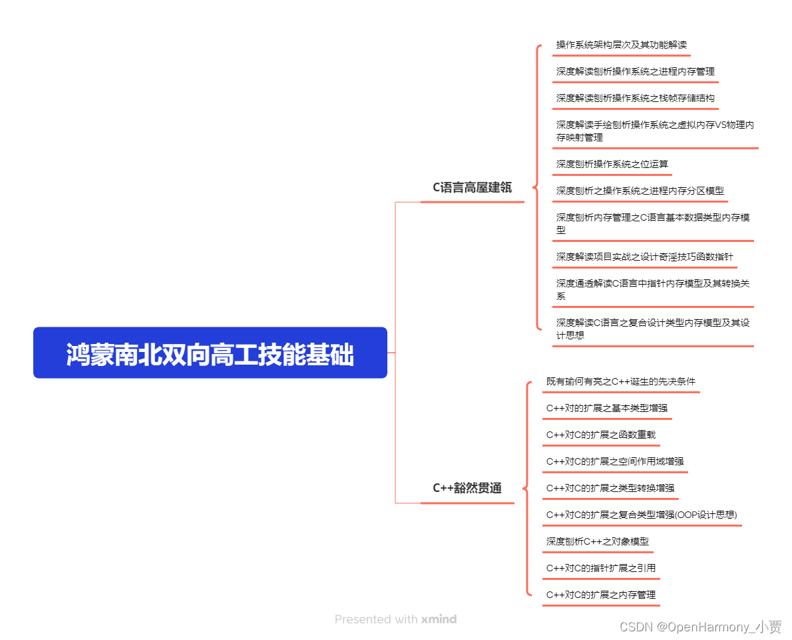
第二阶段:鸿蒙南北双向高工技能基础:gitee.com/MNxiaona/733GH
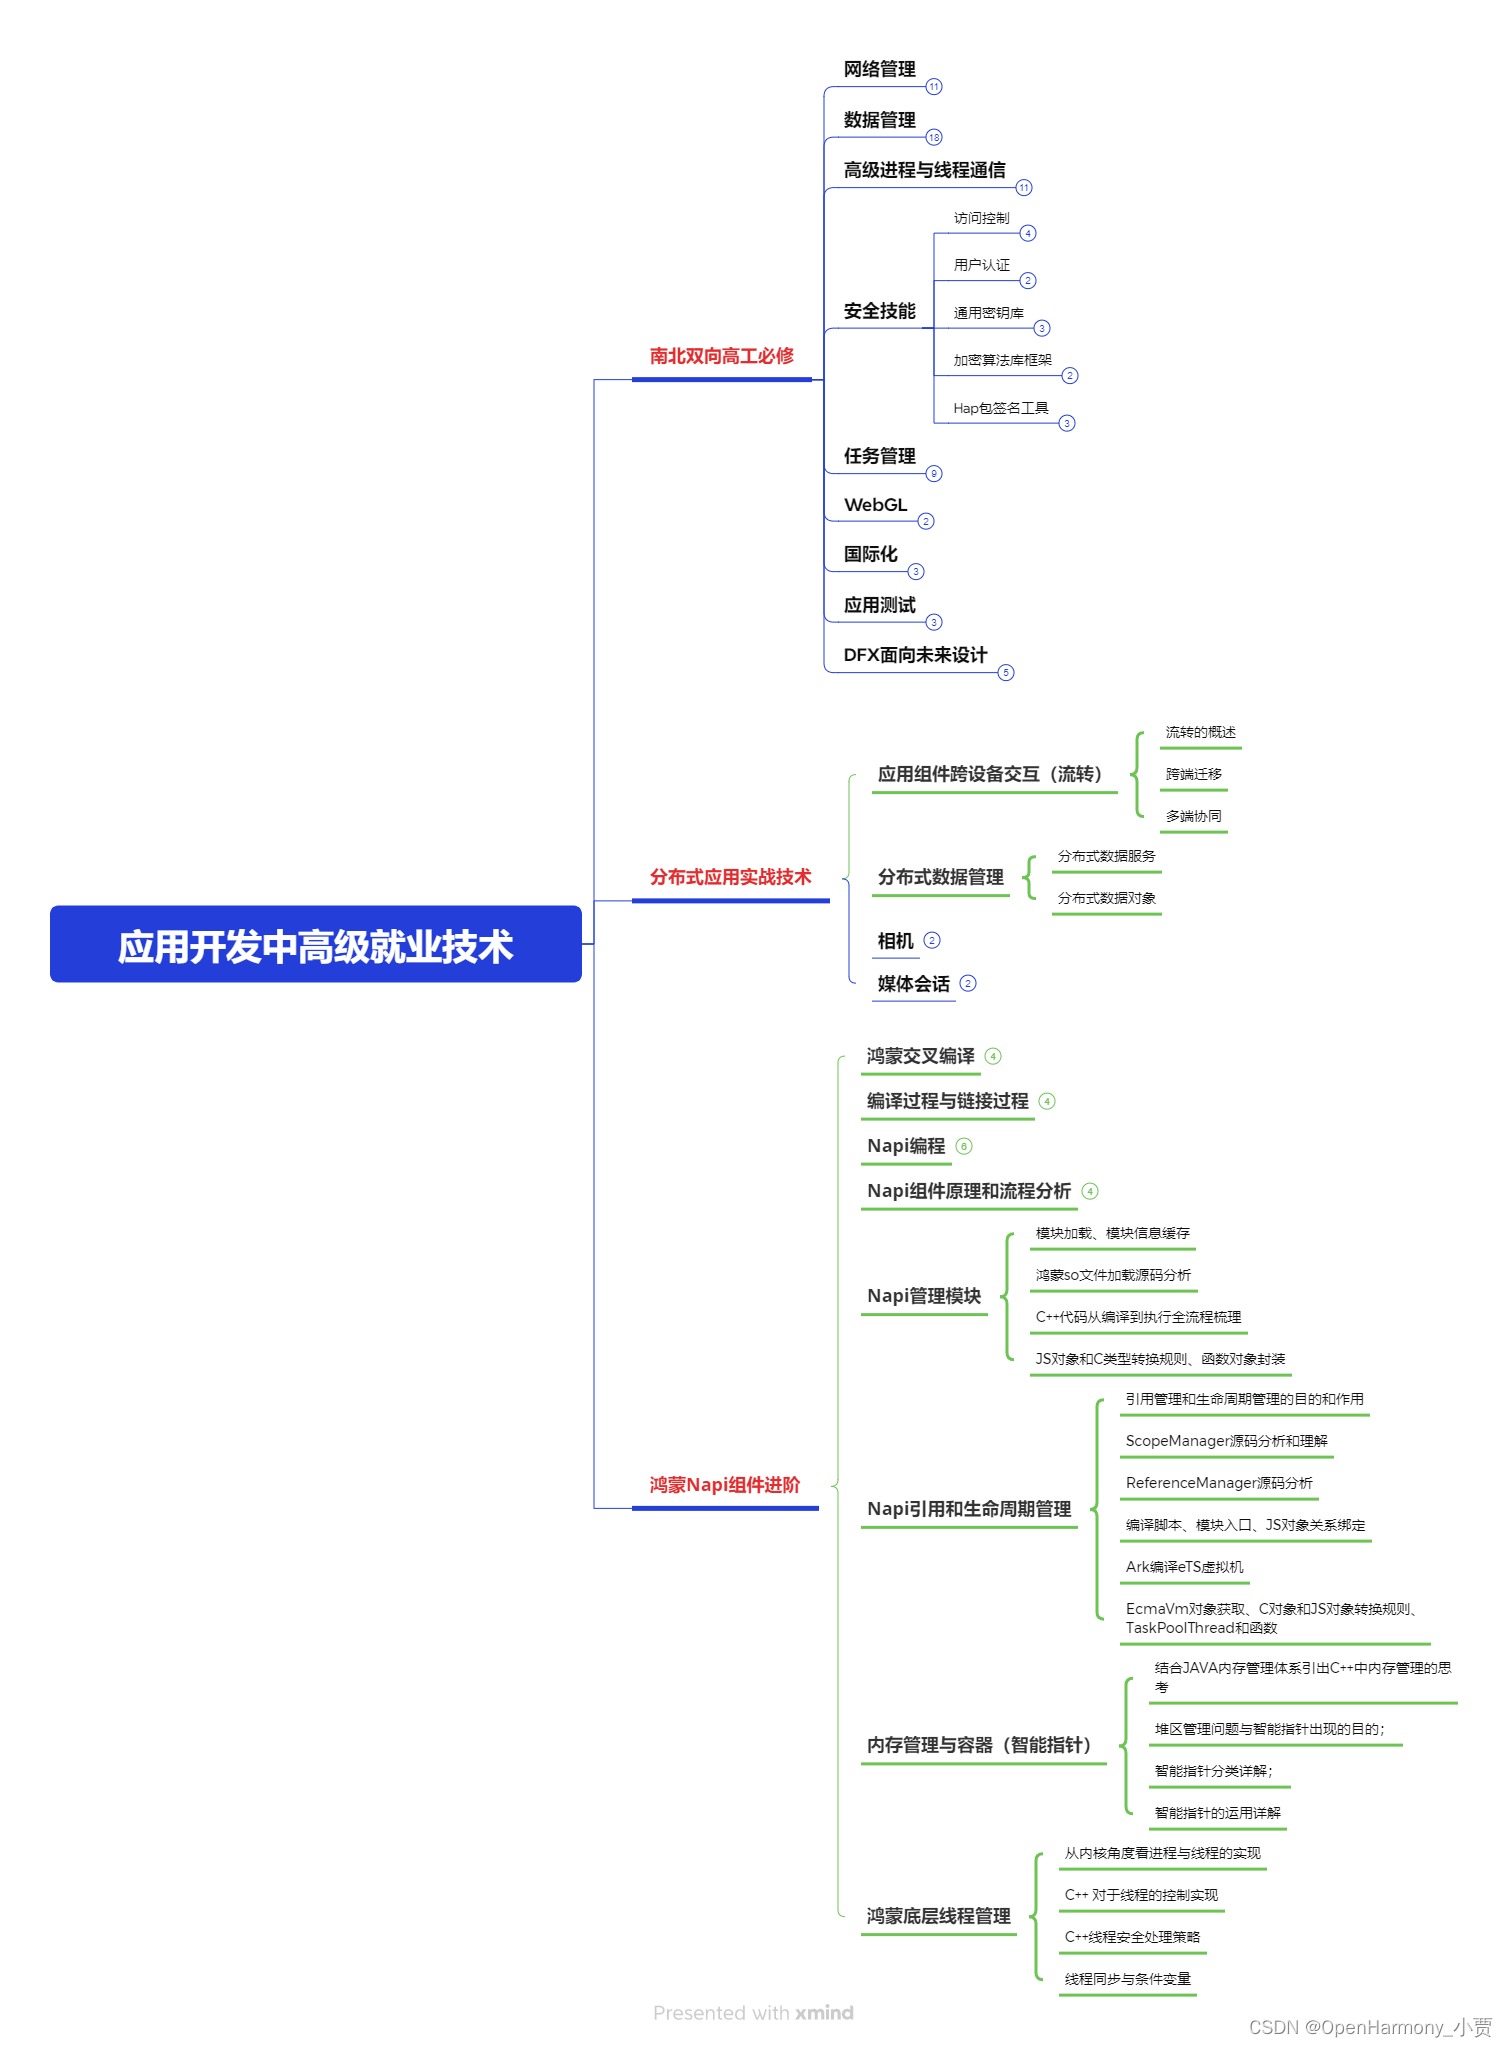
第三阶段:应用开发中高级就业技术
第四阶段:全网首发-工业级南向设备开发就业技术:gitee.com/MNxiaona/733GH
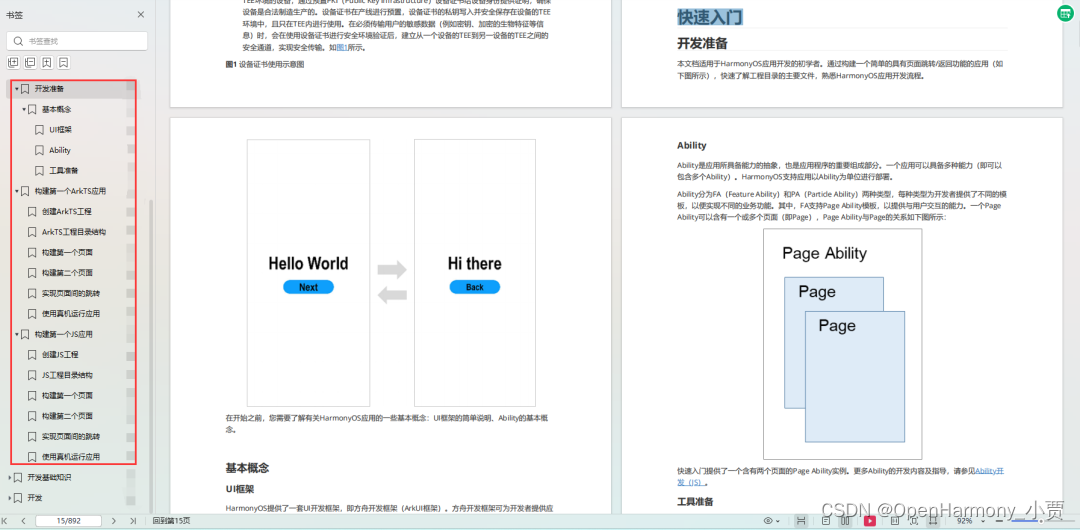
《鸿蒙 (Harmony OS)开发学习手册》(共计892页)
如何快速入门?
1.基本概念
2.构建第一个ArkTS应用
3.……
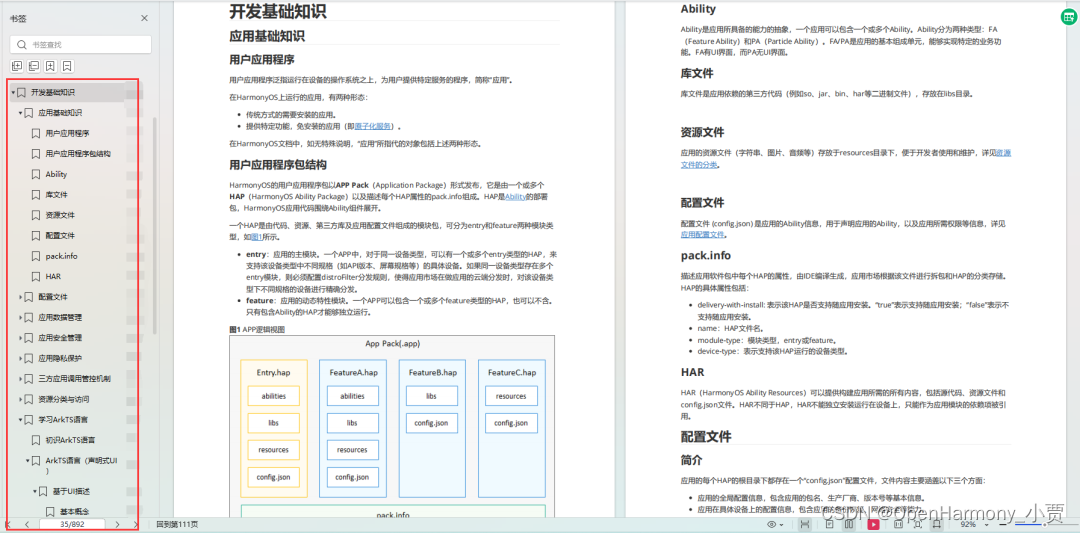
开发基础知识:gitee.com/MNxiaona/733GH
1.应用基础知识
2.配置文件
3.应用数据管理
4.应用安全管理
5.应用隐私保护
6.三方应用调用管控机制
7.资源分类与访问
8.学习ArkTS语言
9.……
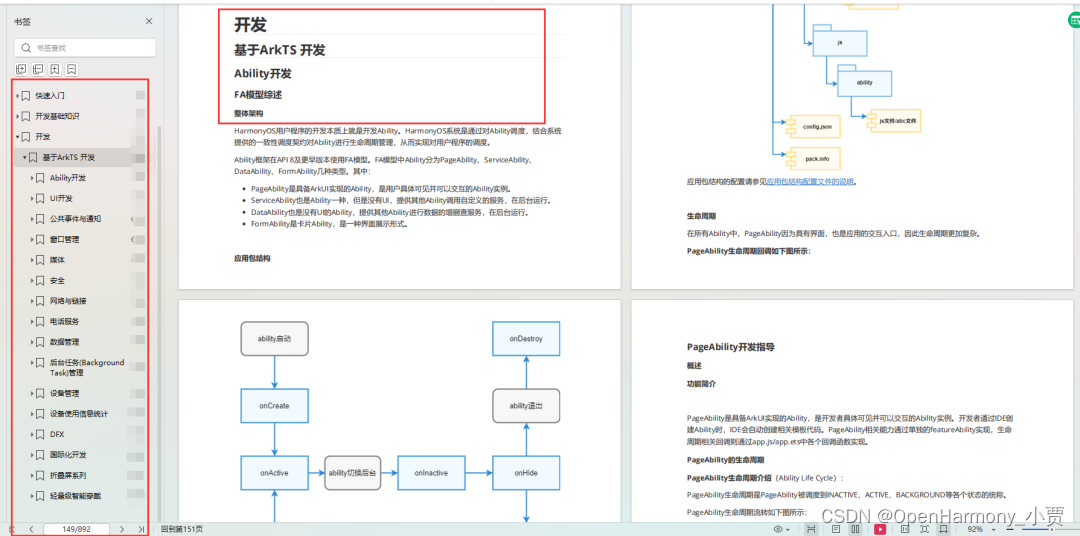
基于ArkTS 开发
1.Ability开发
2.UI开发
3.公共事件与通知
4.窗口管理
5.媒体
6.安全
7.网络与链接
8.电话服务
9.数据管理
10.后台任务(Background Task)管理
11.设备管理
12.设备使用信息统计
13.DFX
14.国际化开发
15.折叠屏系列
16.……
鸿蒙开发面试真题(含参考答案):gitee.com/MNxiaona/733GH
鸿蒙入门教学视频:
美团APP实战开发教学:gitee.com/MNxiaona/733GH
写在最后
- 如果你觉得这篇内容对你还蛮有帮助,我想邀请你帮我三个小忙:
- 点赞,转发,有你们的 『点赞和评论』,才是我创造的动力。
- 关注小编,同时可以期待后续文章ing?,不定期分享原创知识。
- 想要获取更多完整鸿蒙最新学习资源,请移步前往小编:
gitee.com/MNxiaona/733GH


 微信名片
微信名片

评论记录:
回复评论: